
Is the Nation on the Right Track? Depends on How Generous You’re Feeling
December 9, 2025
How Small and Mid-Sized Business Owners Can Harness Innovation to Scale Smarter
December 15, 2025
With so much economic uncertainty right now, many consumers are thinking carefully about big purchases for their homes, especially items like furniture or major appliances. As part of our series examining people’s economic outlook, we asked whether now was a good time to purchase major household items.
Let’s dive into what we found.
Overall
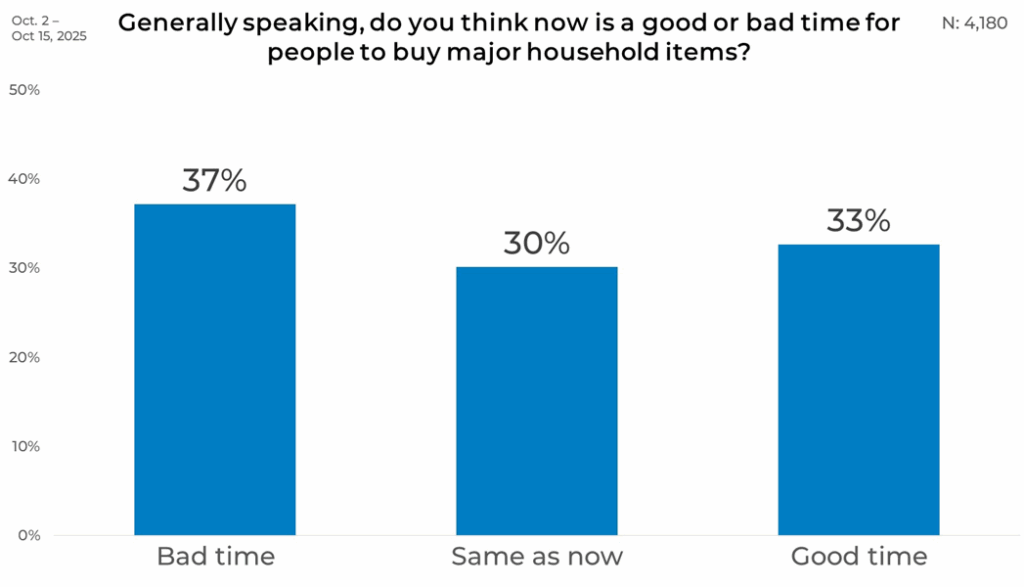
Overall, views are fairly mixed. Across the total sample, 37% report that it is a bad time to buy major household items, whereas 33% report that it is a good time. This is similar to the results we found around people’s view of the economy.
Gender
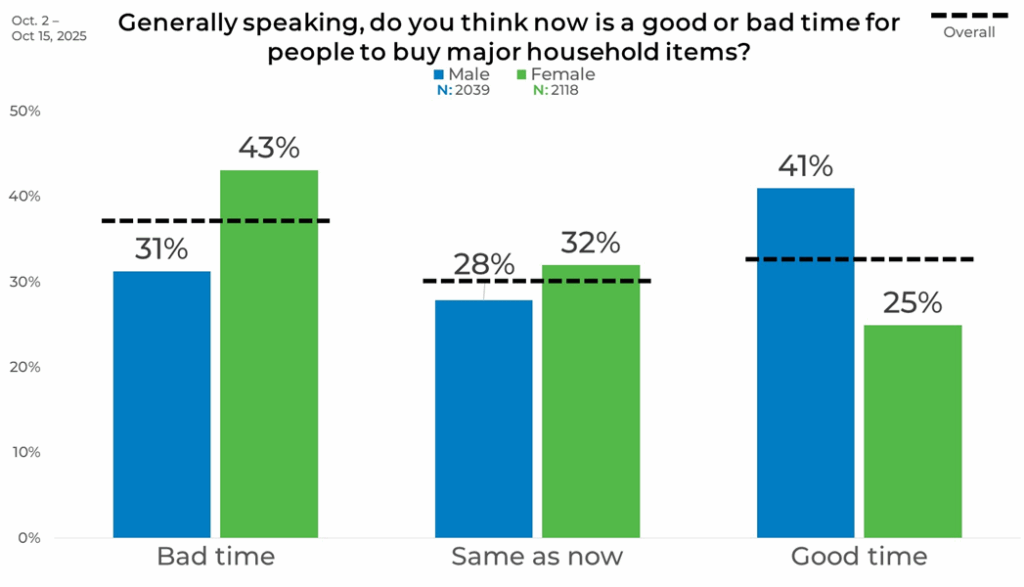
Among men and women, opinions were noticeably different. Men are more optimistic, with 41% reporting that it is a good time to buy these items, compared with 31% who report that it is a bad time. Women, however, adopt a more cautious view: 43% believe it is a bad time, and only 25% consider it a good time. While men show a greater shift toward positive buying conditions, women show a stronger pull toward concern.
Age
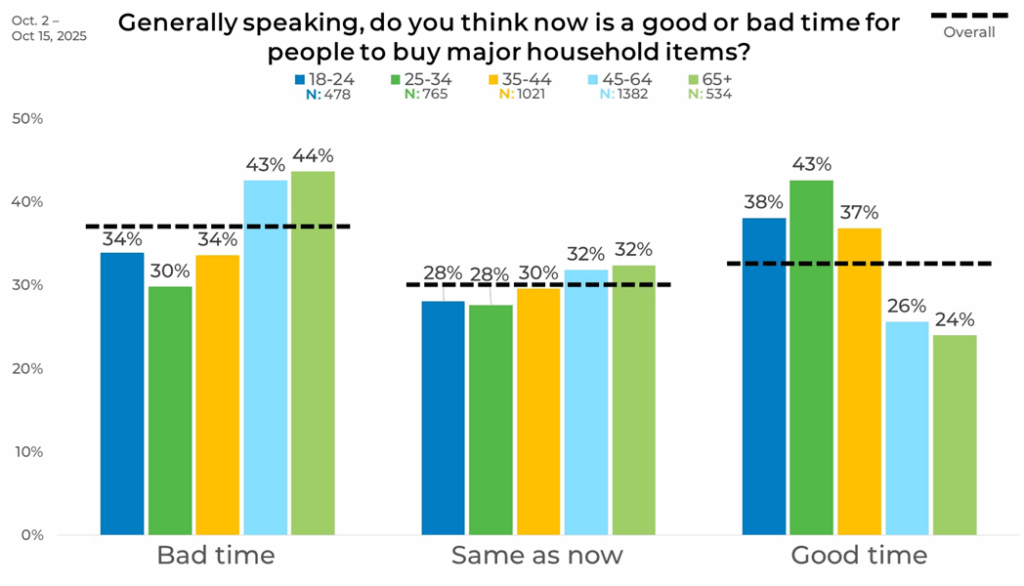
Younger adults aged 18–24 and 25–34 show higher positivity, with good‑time responses at 38% and 43%, respectively. The picture changes across older groups: 45–64 and 65+ show lower optimism, with only 26% and 24% reporting it is a good time.
This difference becomes sharper when comparing bad‑time responses. Adults 45–64 reach 43%, and those 65+ get 44%, creating a clear divide between younger buyers who lean toward opportunity and older buyers who show greater caution.
Income
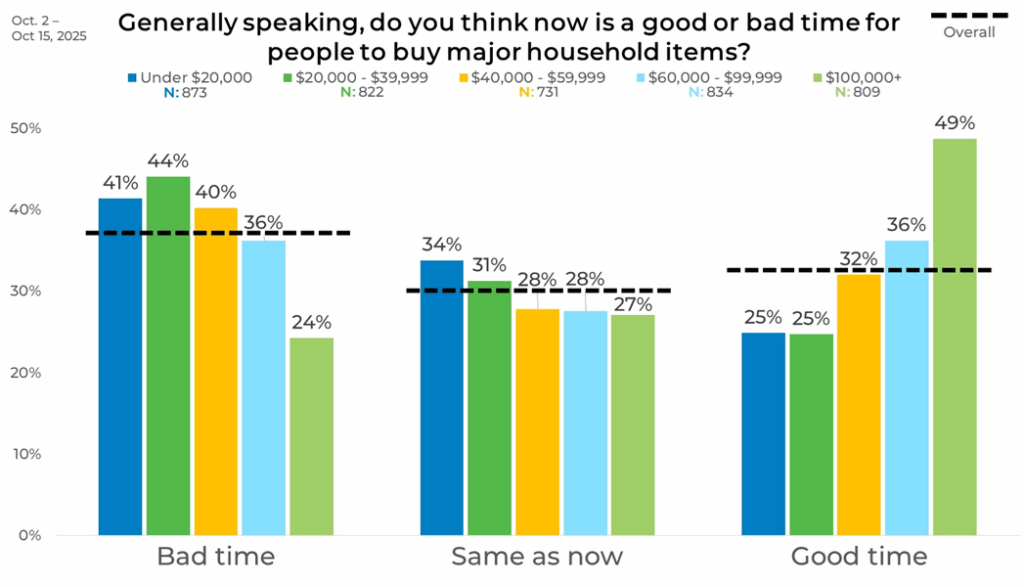
Income shows one of the widest spreads across all the demographics. Households earning under $20,000 report a 41% bad time response and only 25% calling it a good time. As income rises, optimism increases. The highest‑earning group, at $100,000 or more, shows 49% reporting that conditions are good and only 24% reporting that conditions are bad.
The link between earnings and buying confidence becomes clear. Lower‑income groups are more hesitant, while higher‑income groups are more ready to make large purchases.
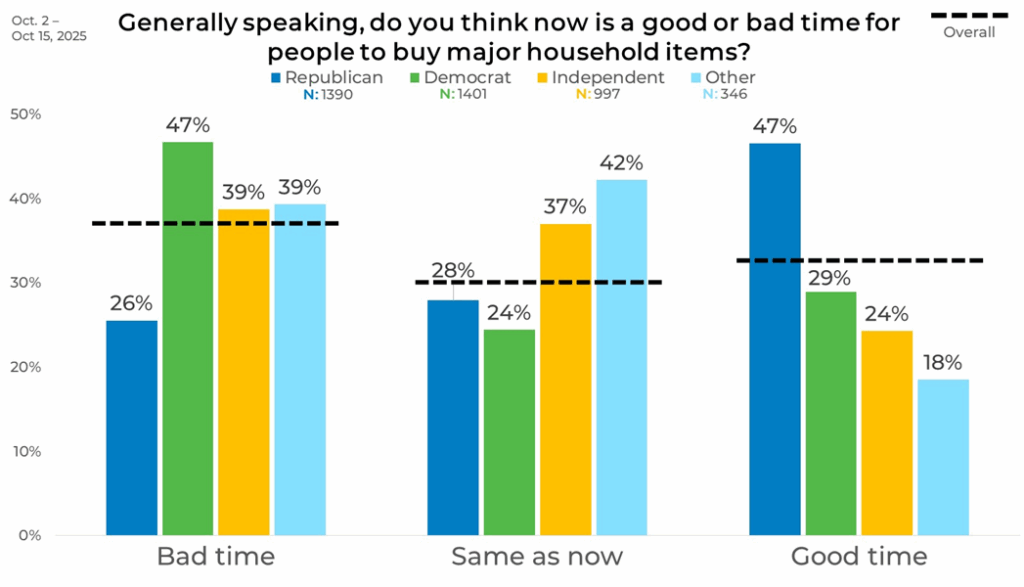
Political Affiliation
There is some significant variation among political affiliations. Republicans are the most positive group, with 47% calling it a good time and only 26% seeing it as a bad time. Democrats move in the opposite direction, with 47% saying it is a bad time and 29% saying it is a good time.
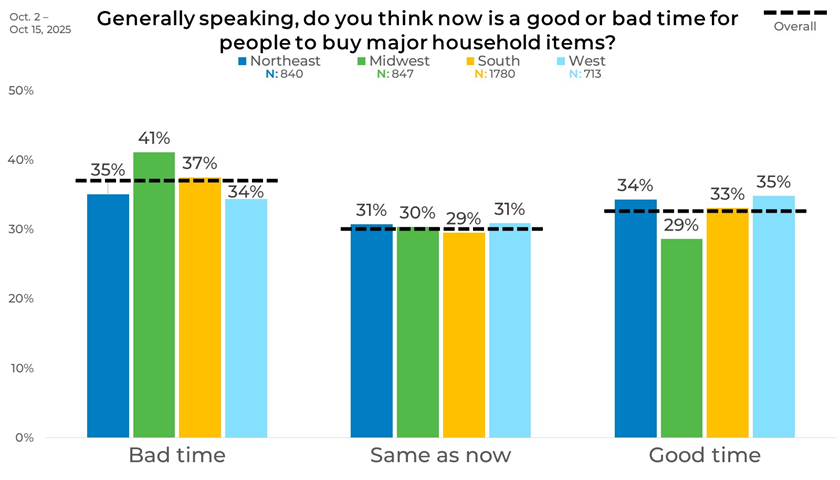
Region
Regional differences remain modest but still visible. In the Northeast, 35% say it is a bad time and 34% say it is a good time. The Midwest leans slightly more negative, with 41% calling it a bad time. The South and West both show more splits, with good time responses at 33% and 35% respectively.
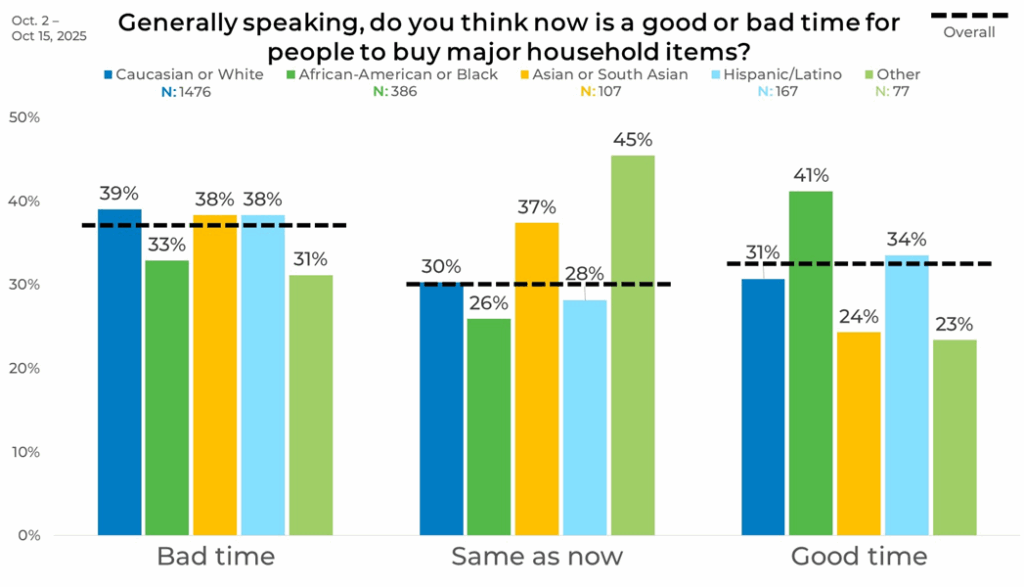
Ethnicity
Ethnicity adds another layer of variety. Caucasian respondents show a nearly even split, with 39% saying it is a bad time and 31% saying it is a good time. African American respondents are more positive, with 41% calling it a good time. Hispanic/Latino respondents fall close to the middle, with 38% saying it is a bad time and 34% saying it is a good time. African American respondents stand out as the most optimistic.
Panel
Looking at the data by panel shows how different sample sources can produce varied results. Panel A shows 39% calling it a bad time and 18% calling it a good time. Panel O swings in the opposite direction, with 41% saying it is a good time. Panel U stands out strongly, with 58% good time responses and only 16% saying it is a bad time.
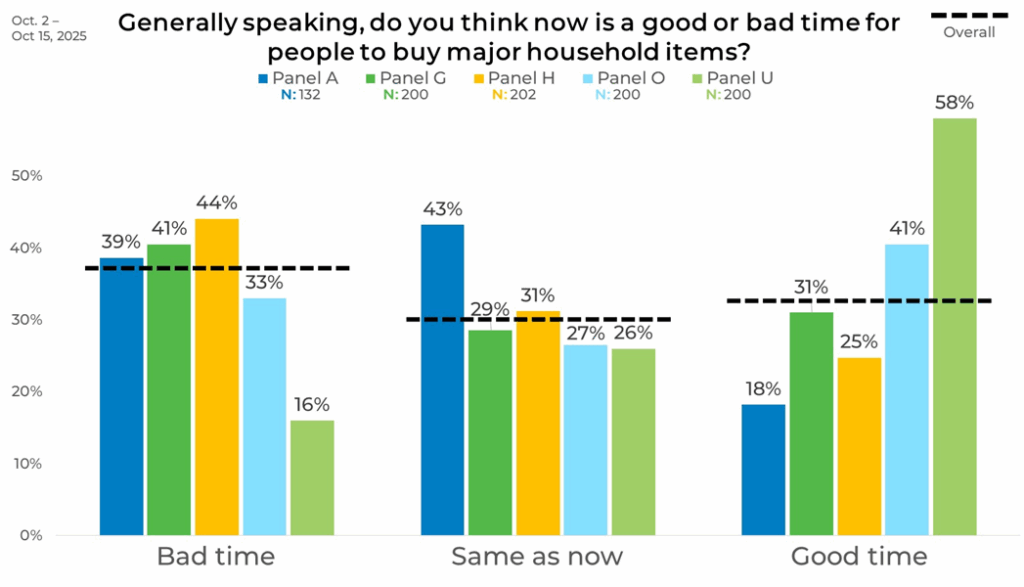
These results highlight why you need to strategically blend your sample when conducting online quantitative research. Strategic blending helps reduce potential bias associated with sample selection.


