
America’s Money Mood for 2026: Cautious Optimism…Emphasis on Cautious.
December 9, 2025
Couches, Fridges, and Financial Fear: Are We Ready to Spend Yet?
December 10, 2025
There have been varying reports recently in the news about the direction the country is headed and how people feel about it. Some days it is sunny skies and rainbows, the next day it is another great depression. We wanted to get a better gauge on how people were really feeling about the future and the direction the country is headed. In our most recent wave of research-on-research, we asked people how they felt.
Here is what we found:
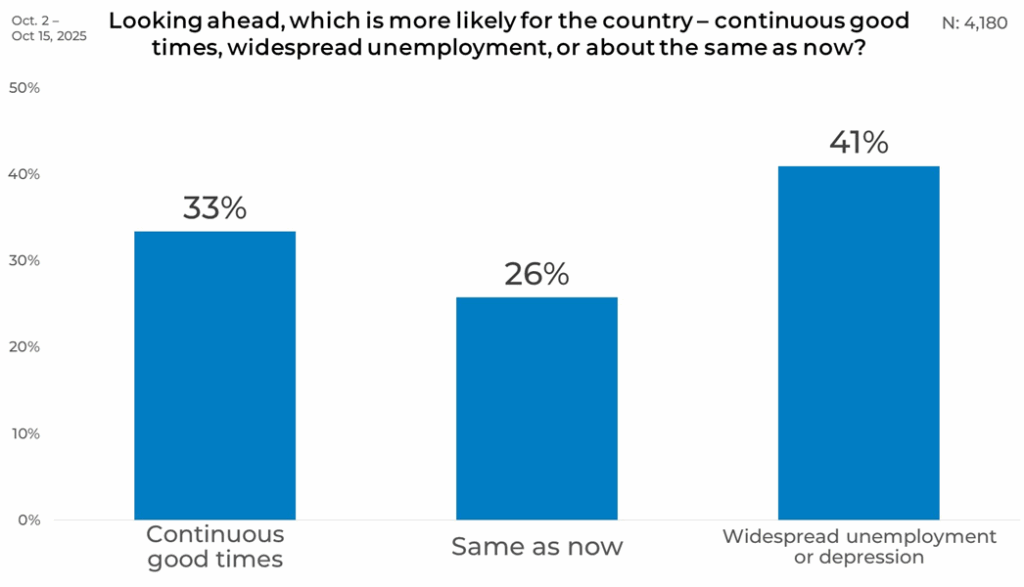
Overall
Overall, 33% of respondents expect continuous good times, while 41% anticipate widespread unemployment or depression. Another 26% believe conditions will remain about the same.
Gender
Among men, 42% expect continuous good times compared to 25% of women. Women are more likely to expect unemployment or depression at 47%, while 34% of men hold that view. The share expecting things to remain the same stays close, with 24% of men and 27% of women choosing that option.

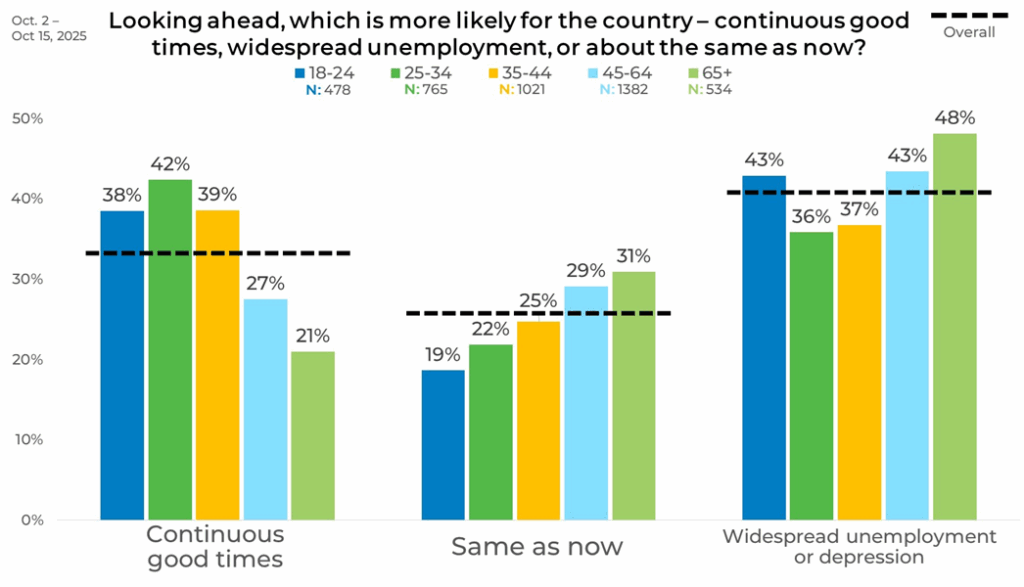
Age
Breaking the data down by age uncovered some interesting trends. Optimism is strongest among adults aged 25–34 at 42% and lowest among those 65+ at 21%. Expectations of unemployment or depression are highest among adults 65+ at 48%, while younger adults aged 18–24 and those 35–44 both stand at 43% and 37%.
A further look shows that expectations for conditions staying the same rise steadily with age, moving from 19% among 18–24‑year‑olds to 31% among adults 65 and older. This gradual progression reflects how views of stability strengthen later in life.
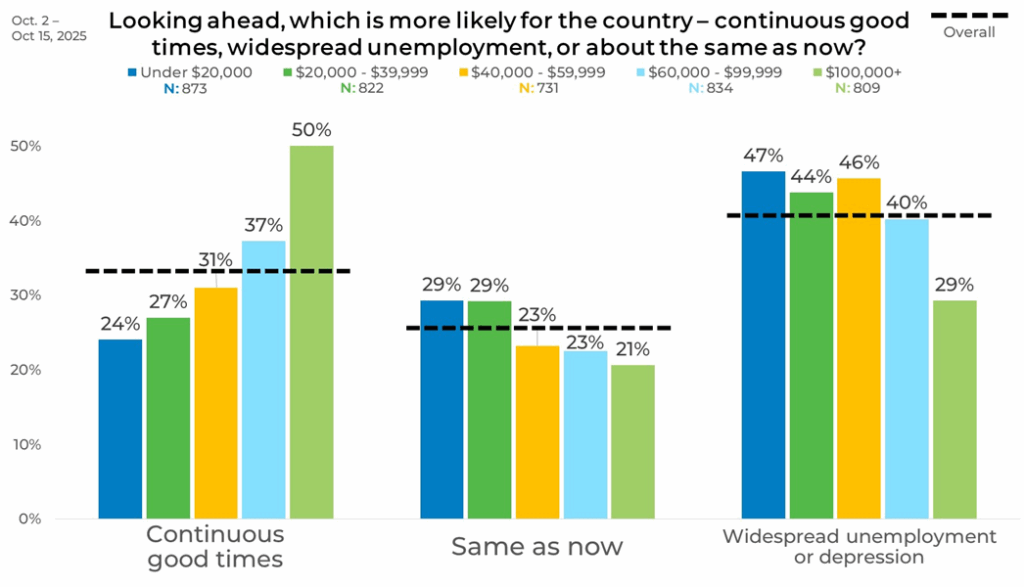
Income
Income levels show some of the most striking contrasts. Optimism rises steadily with income, from 24% among those earning under $20,000 to 50% among those earning $100,000 or more. In contrast, expectations of unemployment or depression are highest among the lowest-income group at 47% and lowest among the highest-income group at 29%.
A deeper comparison shows that the middle response remains fairly stable across income groups, ranging from 21% to 29%. This consistency forms a steady center point even as optimism and concern shift more sharply at the income extremes.
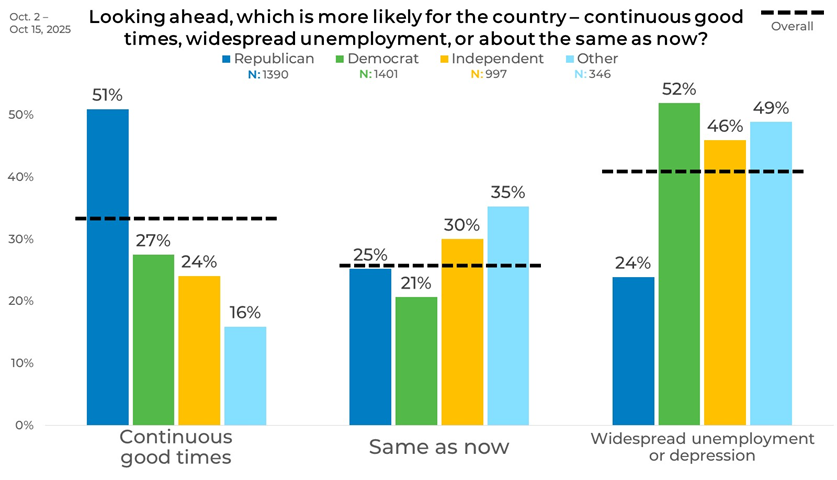
Political Affiliation
Political affiliation shows wide variation in people’s expectations of the future. Republicans lead in optimism, with 51% expecting continuous good times, compared to 27% of Democrats, and 24% of Independents. Democrats are most likely to expect unemployment or depression at 52%, followed by Independents at 46%, and Republicans at 24%.
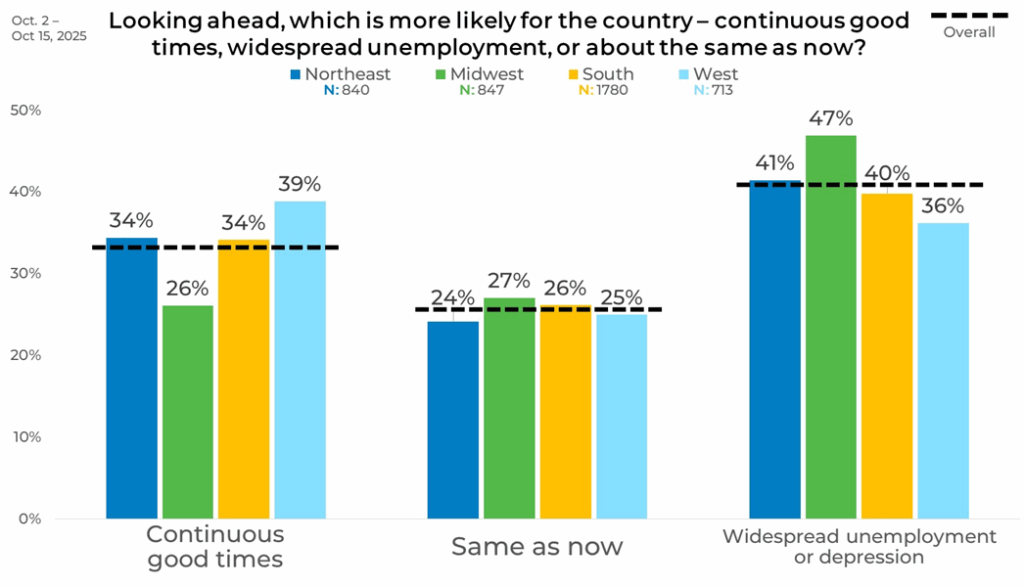
Region
Expectations for continuous good times range from 26% in the Midwest to 39% in the West, with the Northeast at 34% and the South at 34%. Anticipation of unemployment or depression is highest in the Midwest at 47% and lowest in the West at 36%. The “same as now” response stayed relatively steady, with 24% in the Northeast, 27% in the Midwest, 26% in the South, and 25% in the West.
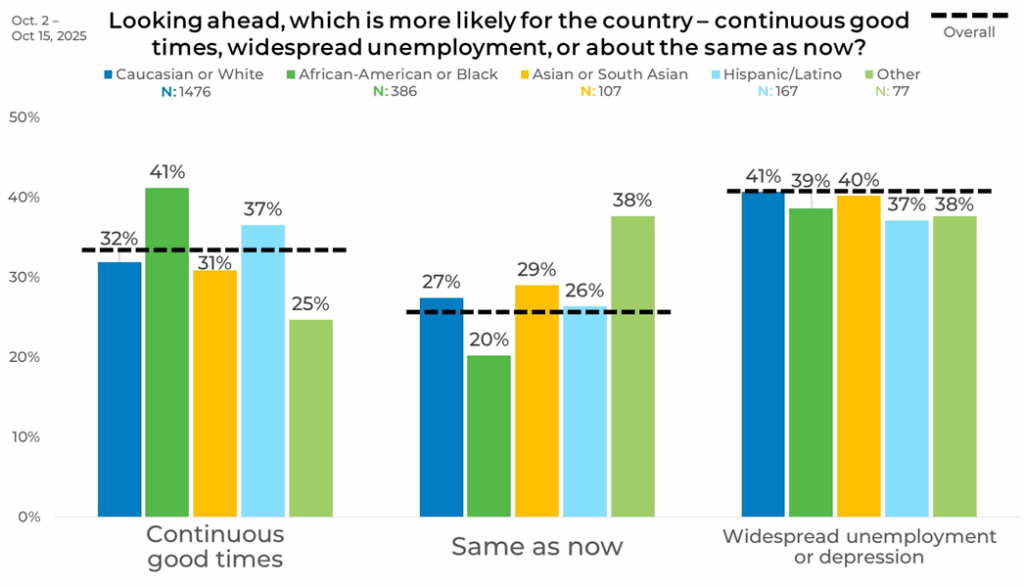
Ethnicity
Ethnicity results show a mix of perspectives of the future. Continuous good times are expected by 41% of African American respondents, 37% of Hispanic/Latino respondents, 32% of Caucasian respondents, and 31% of Asian or South Asian respondents. Expectations of unemployment or depression remain relatively close, ranging from 37% to 41%.
Panel
Looking at the data by panel shows a variety of opinions. Panel U holds the highest optimism at 59%, while Panel M has the lowest at 20%. Expectations of unemployment or depression reach 50% in Panel H and 49% in Panel M, compared to 24% in Panel U.

These results highlight why you need to strategically blend your sample when conducting online quantitative research. Strategic blending ensures you reduce any potential bias that comes with sample source selection.


