
Looking Ahead at Business Conditions: Mixed Signals at Best
February 5, 2026
Swipe the Card or Wait It Out? The Big-Purchase Debate
February 11, 2026
Economic signals shift frequently, but at times the current signals give people opinion on how the economy will look over a longer period of time. In this final installment in our series exploring US consumer sentiment, we asked consumers to consider the direction of the national economy over the next five years.
Let’s dive into what US consumers are saying.
Overall
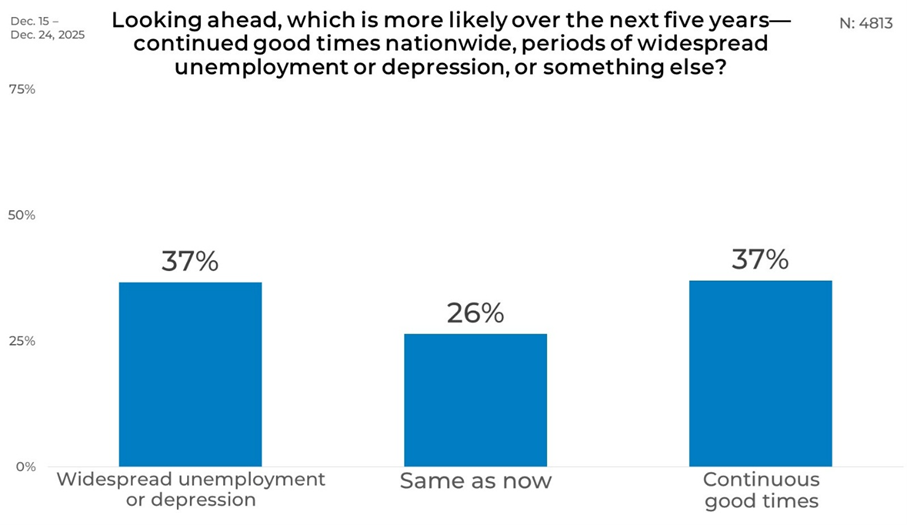
When asked to look ahead five years into the national economic future, respondents are evenly divided between optimism and concern. Overall, 37% say continuous good times are more likely, while an equal 37% expect periods of widespread unemployment or depression. Another 26% believe conditions will remain largely the same as they are now, reflecting a substantial share that anticipates stability rather than major change.
Gender
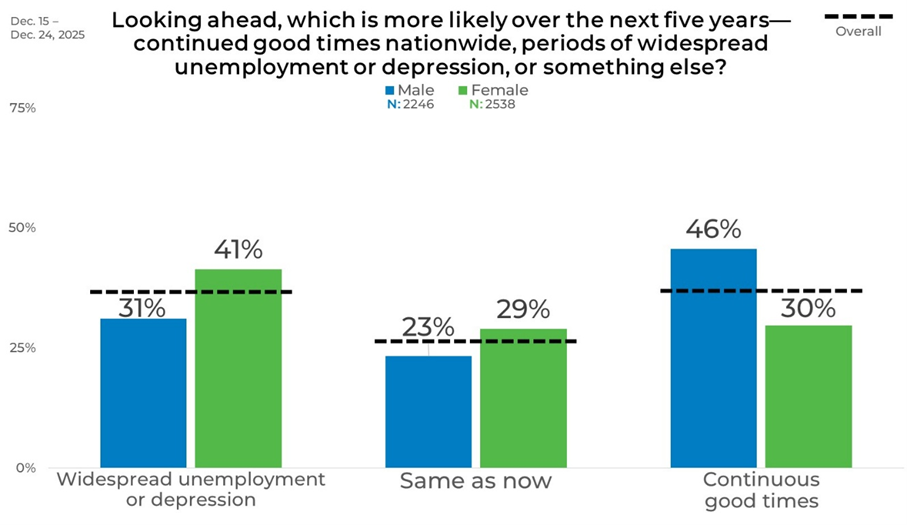
There are some noticeable differences when looking at the data by gender. Among men, 46% anticipate continuous good times, making this the most common response in that group, while 31% expect widespread unemployment or depression and 23% foresee conditions staying about the same. Women, by contrast, are more inclined toward concern, with 41% expecting widespread unemployment or depression. Smaller shares of women expect continuous good times (30%) or economic conditions similar to the present (29%).
Age
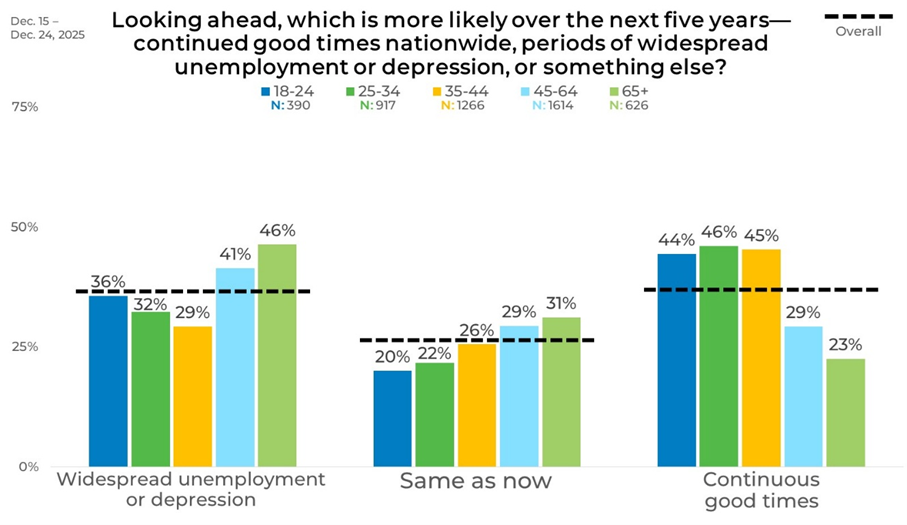
Expectations vary by age. Younger adults are more optimistic, with 44% of those ages 18–24 and 46% of those ages 25–34 expecting continuous good times. These younger groups are less likely to anticipate unemployment or depression compared with older respondents. Among those ages 45–64, concern rises, with 41% expecting unemployment or depression and 29% anticipating good times. Adults ages 65 and older are the most concerned, with 46% expecting unemployment or depression, 31% expecting conditions to remain the same, and just 23% anticipating continuous good times.
Income
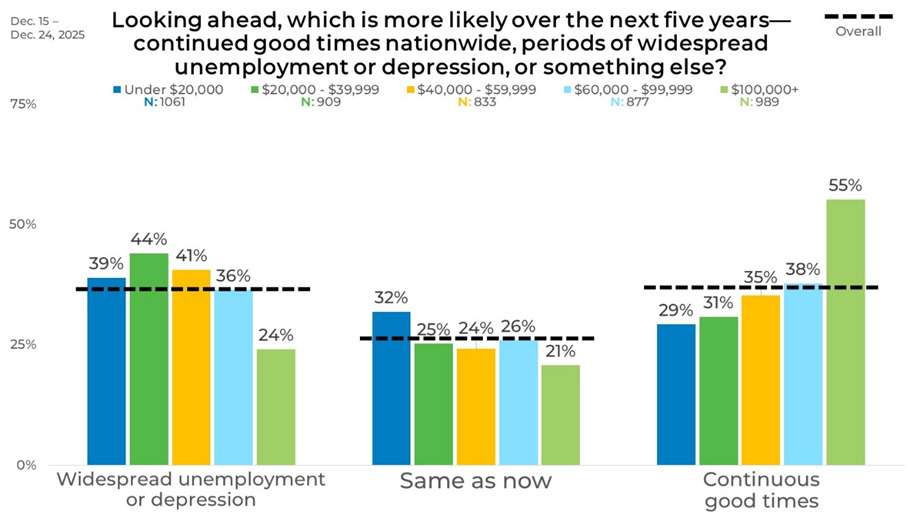
Respondents earning under $20,000 are more likely to expect unemployment or depression (39%) than continuous good times (29%), with nearly a third expecting conditions to stay the same. This pattern of greater concern continues through middle-income groups. In contrast, optimism increases at higher income levels: among those earning $100,000 or more, a majority (55%) expect continuous good times, while only 24% anticipate unemployment or depression.
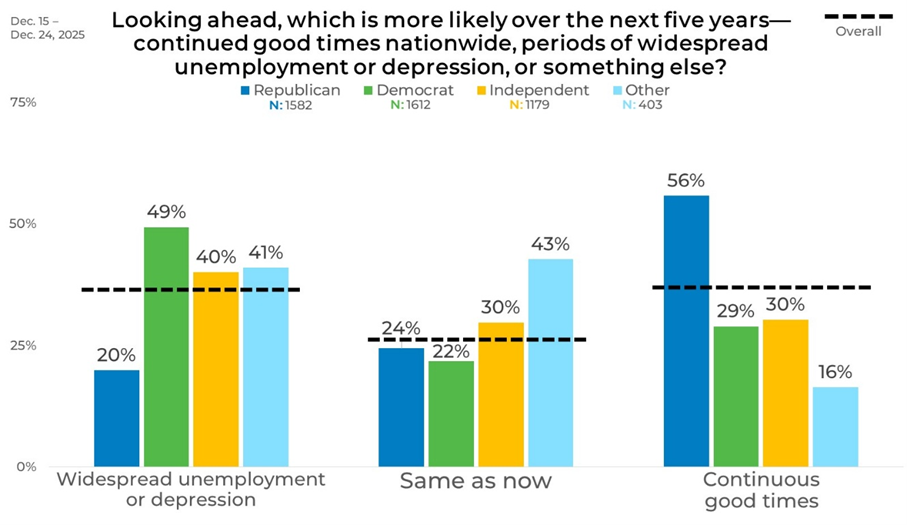
Political Affiliation
Economic outlook varies sharply by political affiliation. A majority of Republicans (56%) expect continuous good times, while just 20% anticipate widespread unemployment or depression. Democrats show the opposite pattern, with nearly half (49%) expecting unemployment or depression and 29% anticipating good times. Independents are more evenly distributed, with 40% expecting unemployment or depression, 30% anticipating good times, and another 30% expecting conditions to remain the same. Among those identifying as Other, 41% expect unemployment or depression, 43% foresee conditions staying about the same, and 16% expect continuous good times.
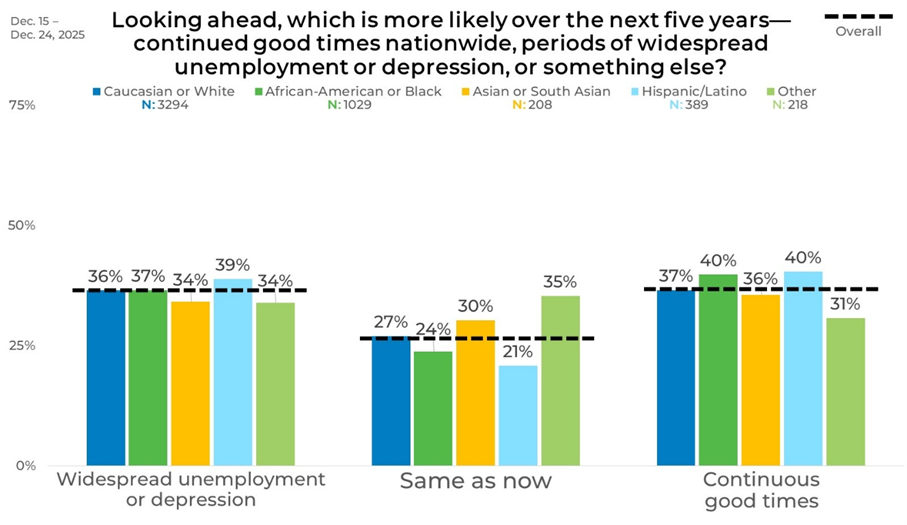
Ethnicity
Across different ethnicities, expectations are relatively balanced, with no single outcome dominating by large margins. White respondents are evenly split between continuous good times (37%) and unemployment or depression (36%). Black respondents show slightly more optimism, with 40% expecting good times and 37% expecting unemployment or depression. Hispanic respondents also show a similar balance, with 40% expecting good times and 39% anticipating unemployment or depression.
Panel
Panel groups display some of the widest variations in outlook, underscoring the importance of considering blended perspectives rather than relying on a single panel. The sharpest contrast is between Panel A and Panel L. In Panel A, 43% expect widespread unemployment or depression and 22% anticipate continuous good times, while Panel L shows the opposite pattern, with 56% expecting good times and 25% expecting unemployment or depression.
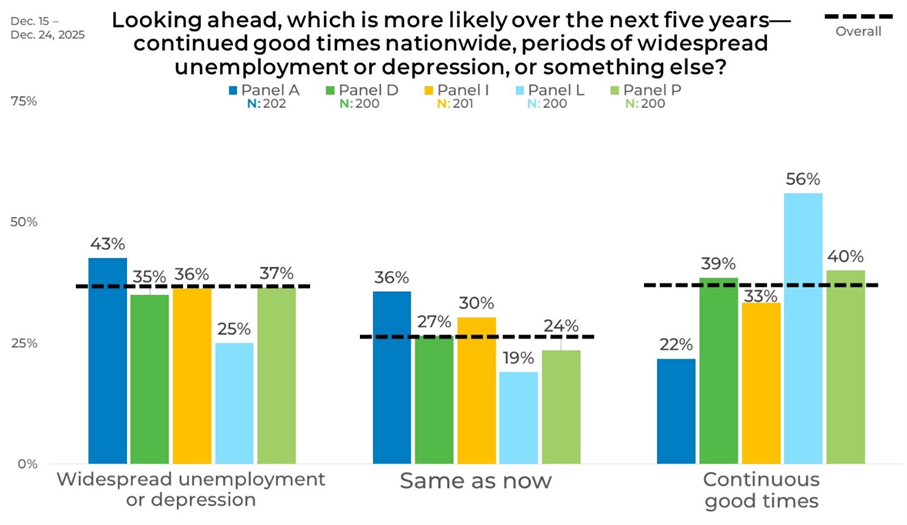
This data highlights the need to understand the attitudes and behaviors of your sample sources as you select them for your studies. Picking the wrong combination can lead to misleading insights, and ultimately, the wrong decision.
Learn about how EMI’s strategic sample blending approach can help.

