
A Quirks Chicago Recap with a First Timer and a Seasoned Vet
April 9, 2025
5 Key Takeaways from the Insights Association’s Ignite: Data Quality Conference
April 21, 2025
Today is Tax Day here in the United States. This marks the end of the tax season (for many, that is), with many of us having filed our taxes and others scrambling to get theirs submitted before the end of the day. With multiple ways to file taxes and everyone hoping for a positive outcome (read: not having to owe more), we wanted to understand better the method people are using to file and what they expect the result will be this year.
Let’s dive into what we uncovered from our most recent wave of research-on-research.
File Taxes
Overall
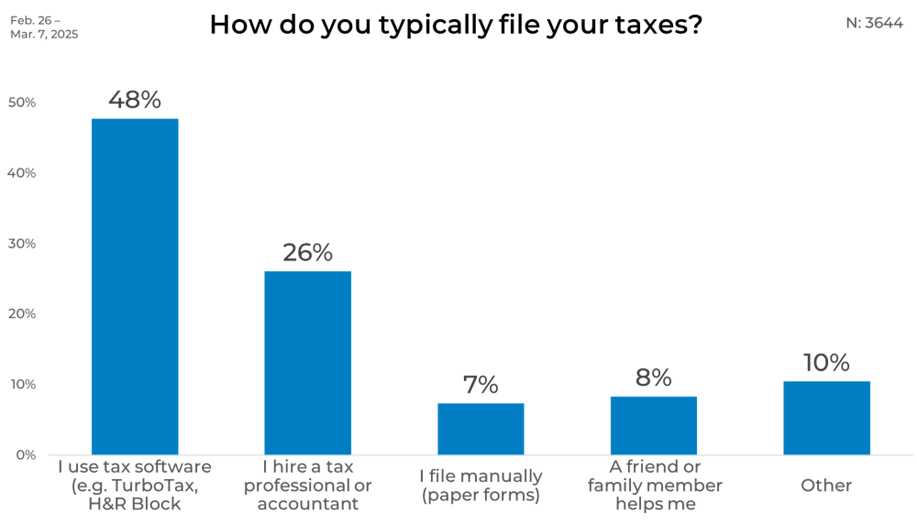
Nearly half of the respondents used tax software such as TurboTax or H&R Block to file their returns. Hiring a tax professional comes in second at 26%, while manual paper filing and help from friends or family make up smaller portions. The remaining 10% fall into an “Other” category, a range of alternative filing methods.
Gender
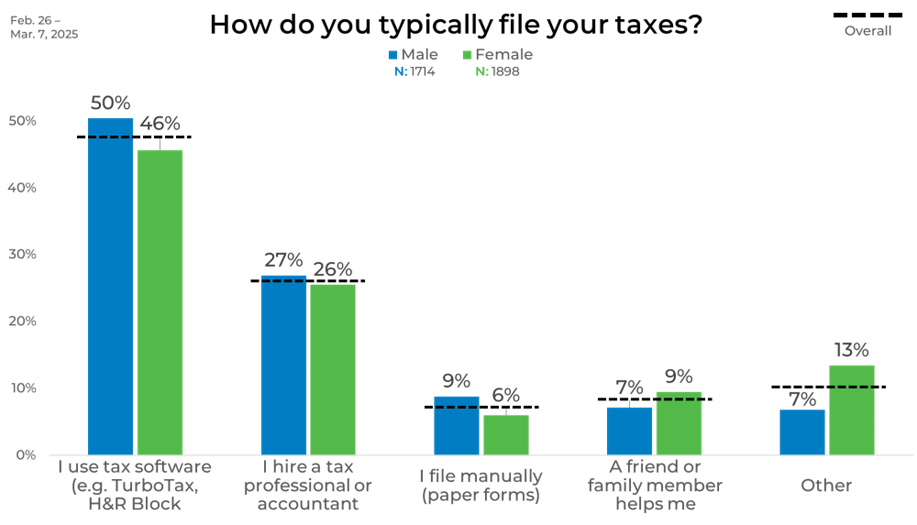
Looking at gender differences, men are slightly more likely than women to use tax software, with 50% of men choosing this method compared to 46% of women. Filing with the help of a friend or family member is more common among women, while men are somewhat more likely to file manually or hire a professional.
Age
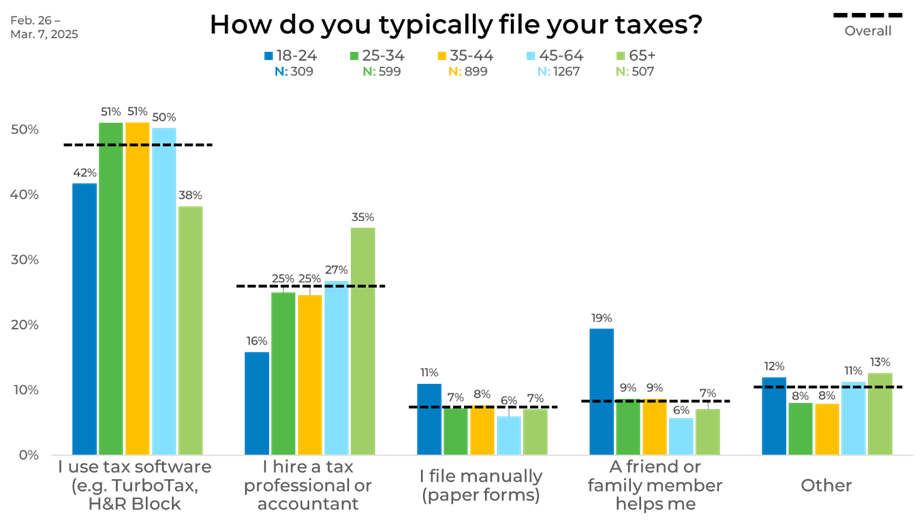
Age plays a clear role in tax-filing preferences. Those aged 25 to 44 are most likely to use tax software, with over half in these age groups preferring the convenience and affordability of digital tools. This trend continues among those aged 45 to 64, though at a slightly lower rate.
Younger adults aged 18 to 24 are the least likely to use tax software and show the highest rate of relying on help from friends or family—nearly one in five. Manual filing is also more common in this group, possibly reflecting limited experience or access to digital tools. At the other end of the spectrum, older adults aged 65 and up are most likely to hire professionals.
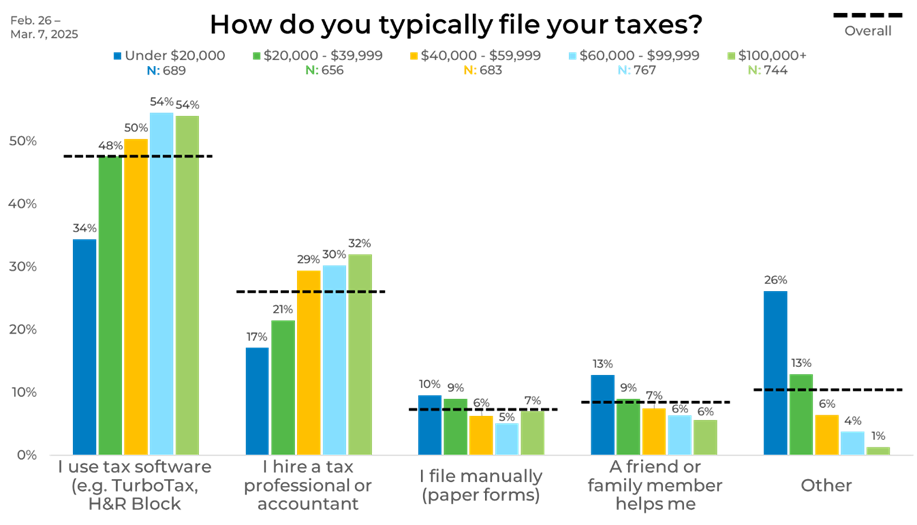
Income
Similar to age, income also seems to influence filing methods significantly. Higher earners ($60,000 and above) are more inclined to use tax software, with 54% choosing this method, and up to 32% hiring a tax professional. These two options dominate among middle-to-high-income brackets, showing consistency across the $60,000 to $99,999 and $100,000+ ranges. Manual filing and informal help are uncommon in these groups, with friend or family assistance and “Other” methods dropping to just 4-6%.
In contrast, lower-income respondents, especially those earning under $20,000, show more varied filing habits. Only 34% use tax software, and just 17% hire a professional. Many turn to alternative methods (26%) or receive help from a friend or family member (13%), indicating less reliance on formal channels. Manual filing is also more common (10%), highlighting a divide in filing preferences tied closely to income level.
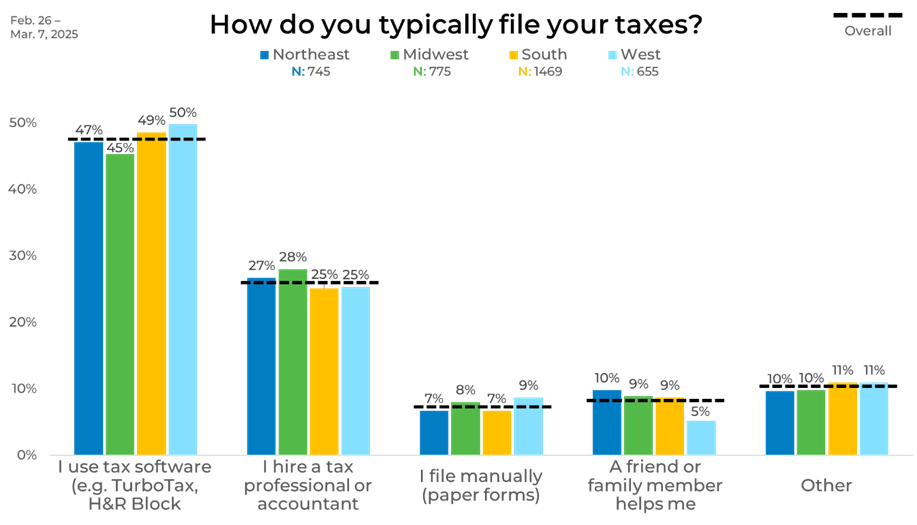
Region
The data by region reveals similar software usage across the country, ranging from 45% in the Midwest to 50% in the West. The Northeast shows a higher reliance on friends or family for help at 10%, while the West has the lowest at 5%. Manual filing and hiring professionals are relatively consistent across regions, offering few surprises.
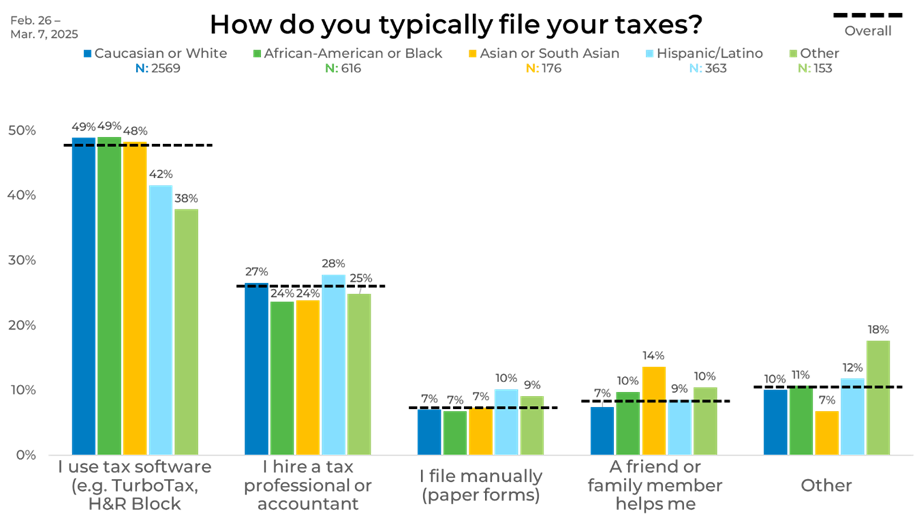
Ethnicity
Examining the data by ethnicity uncovered a couple of interesting insights. Among ethnic groups, tax software usage is consistent at around 48-49% for Caucasian, African American, and Asian respondents but slightly lower for Hispanic/Latino respondents (42%). Family or friend assistance is highest among Asians (14%) and African Americans (10%).
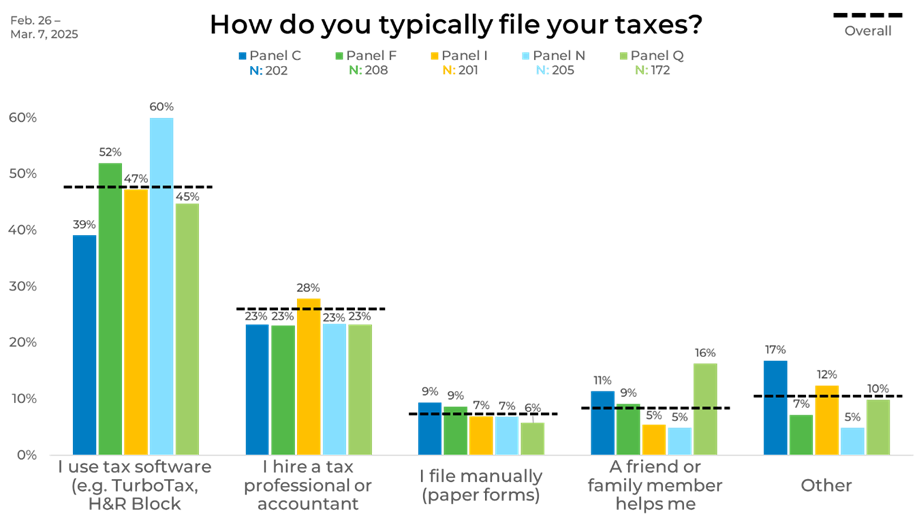
Panel
Breaking the data down by panel, we found that tax software remains the dominant filing method, though rates can vary by up to 21 percentage points. Panel N has the highest use (60%), while Panel C has the lowest (39%). This marks a clear contrast of 21 points between the panels.
Expected Outcomes
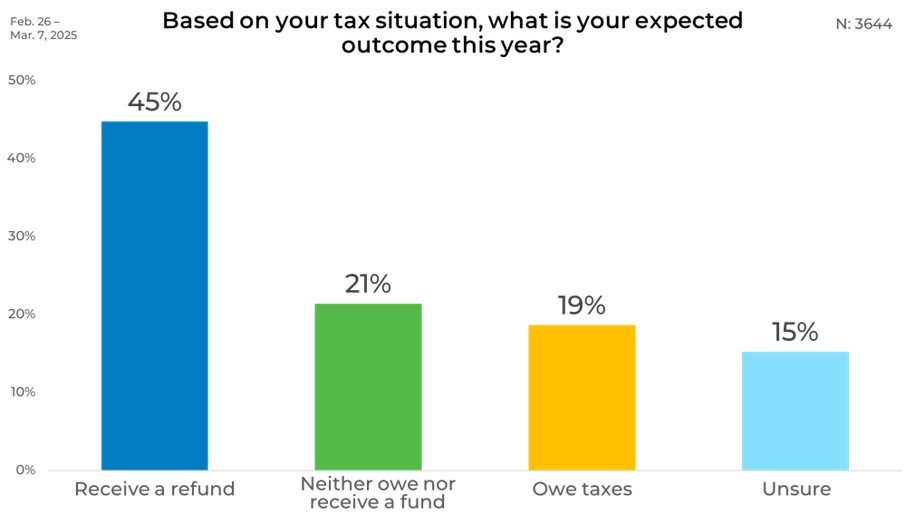
Next, we turn to the expected outcomes from filing taxes. Expectations run the gamut from hopeful refund anticipation to bracing for a tax bill or grappling with uncertainty.
Overall, 45% of respondents expect to receive a refund this year, making it the most common outlook. Meanwhile, 21% predict they will break even, and 19% expect to owe money. Another 15% are unsure of their tax outcome, indicating uncertainty as filing deadlines approach.
Gender
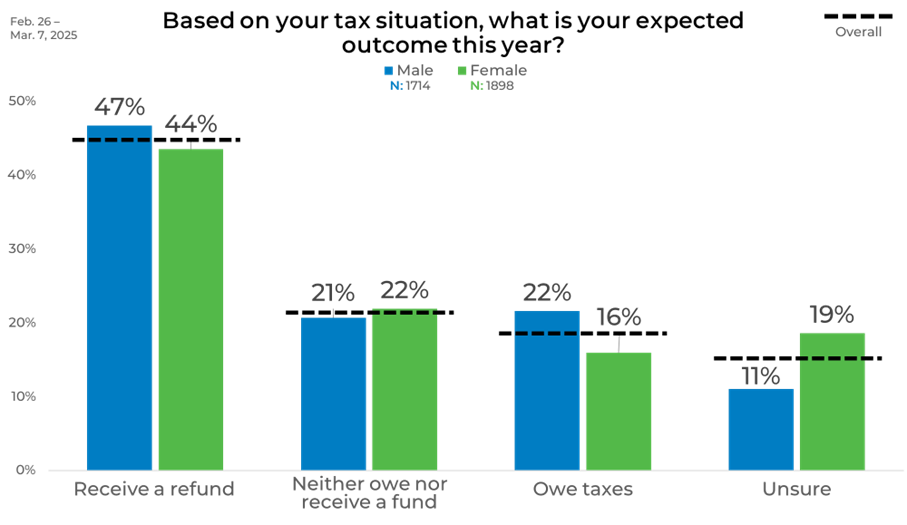
Men are slightly more likely to expect a refund (47%) than women (44%) when we break the data down by gender. However, men are also more likely to expect to owe taxes (22% vs. 16%), while women report more significant uncertainty about their outcome (19% vs. 11%).
Age
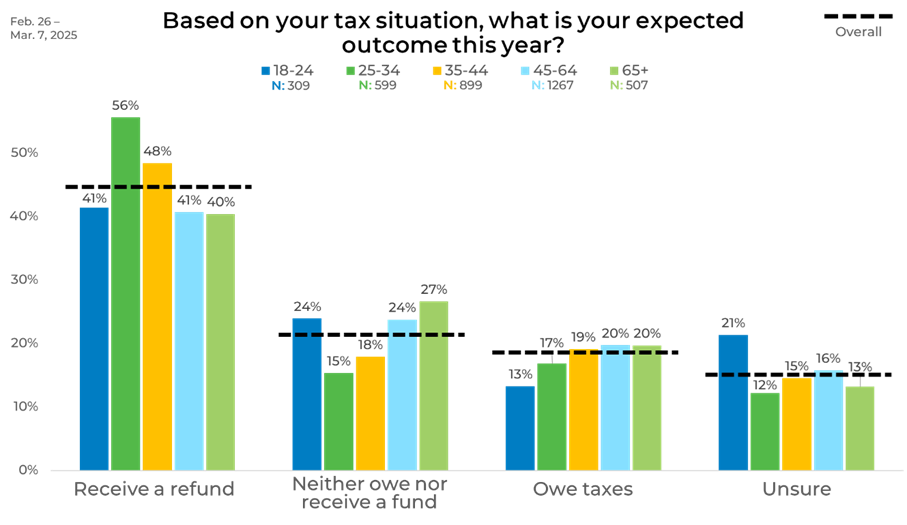
Age affects outcome expectations from tax filing. 25-34-year-olds are the most optimistic, with 56% expecting a refund. This drops to 41% among those aged 18-24 and 45-64 and 40% among seniors. Older age groups are more likely to expect a neutral outcome, while the youngest adults (18-24) report the highest level of uncertainty at 21%.
Income
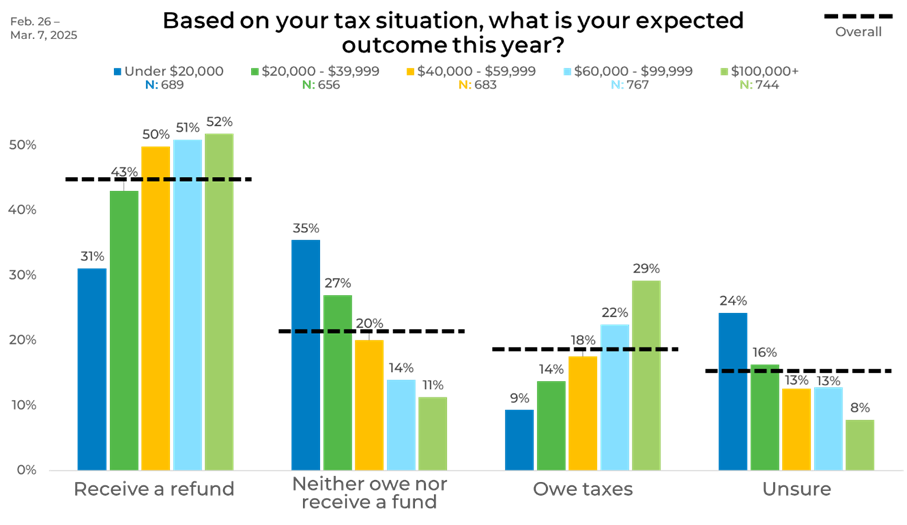
Income has strong correlations with tax filing outcome expectations. Higher earners ($60,000 and above) are most likely to expect a refund, with over half in the $60,000-$99,999 and $100,000+ ranges expecting money back. However, this group also reports the highest likelihood of owing taxes—up to 29% among those earning $100,000 or more. Lower-income earners (under $20,000) are less likely to receive refunds (31%) and more likely to report uncertainty (24%) or a neutral outcome (35%).
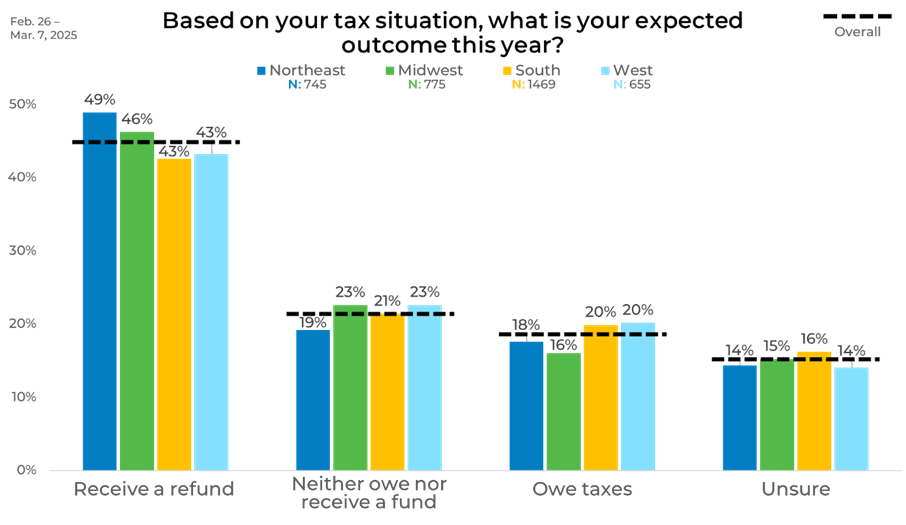
Region
Across U.S. regions, the Northeast leads in refund expectations at 49%, followed closely by the Midwest (46%), South (43%), and West (43%). Residents of the Midwest and West are slightly more likely to expect a neutral outcome. Uncertainty levels are relatively consistent, ranging from 14% to 16% across regions.
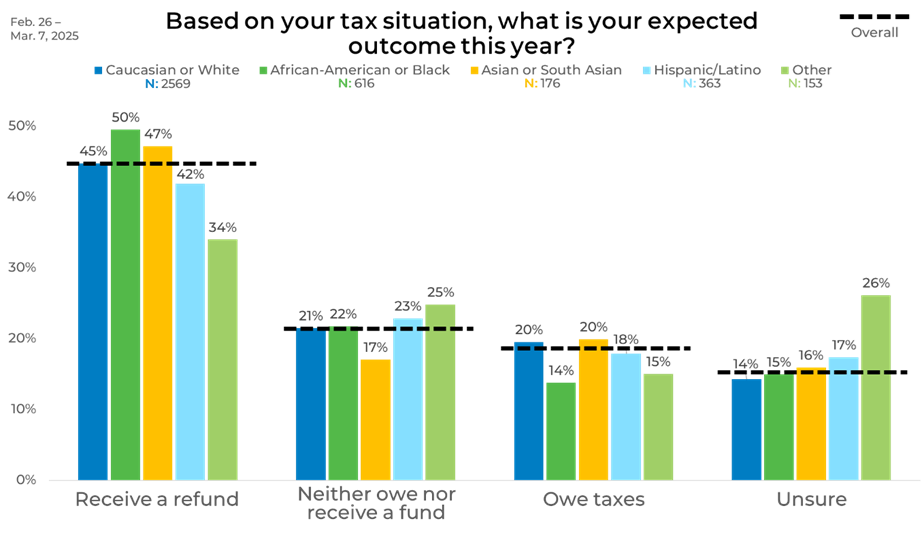
Ethnicity
African American respondents report the highest expectation of receiving a refund (50%), while the “Other” group reports the lowest (34%). Asian and Caucasian respondents fall in the mid-40% range but also have the highest levels of respondents who expect to owe money.
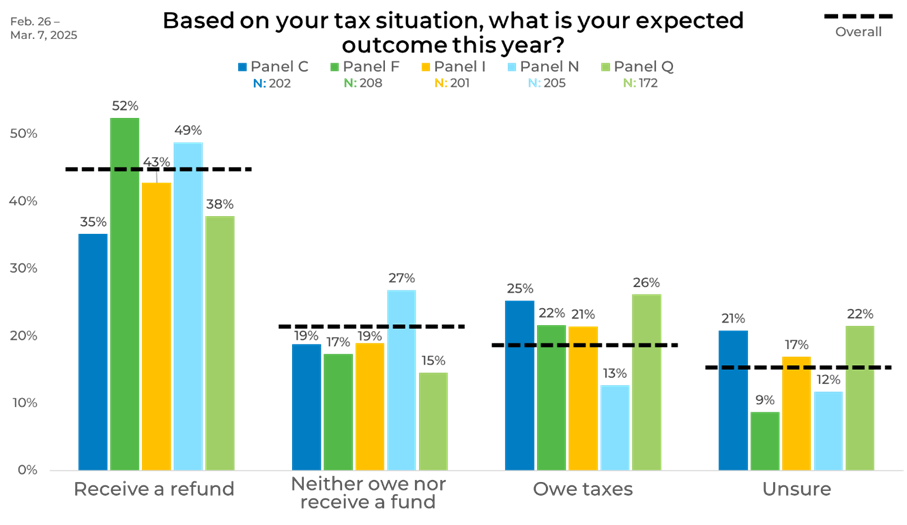
Panel
Results by panel source again highlight variation in expectations, with refund expectation having a difference of up to 17 percentage points. Panel F reports the highest expected refund rate at 52%, compared to just 35% in Panel C. The percentage expecting to owe taxes varies by 13 points, from 13% in Panel N to 26% in Panel Q. Similarly, uncertainty fluctuates by as much as 13 points, ranging from 9% in Panel F to 22% for Panel Q. These gaps underscore how perspectives can shift significantly depending on the data source.
To best mitigate bias that can occur with panel selection, learn more about EMI’s strategic sample blending approach.


