
Finding Your Entrepreneurial Path:A Guide to Choosing the Right Business
November 11, 2024Welcoming New Faces To Our Team!
November 12, 2024Voter Commitment in 2024: Insights and Comparisons to Election Result
The week leading up to the 2024 presidential election provided a unique opportunity to capture voter intent and likelihood, which is exactly what we did. From October 24 to November 1st 2024, we asked Americans how likely they were to vote in the election, on a scale of 1 to 10. This data serves as a snapshot of expected turnout across various demographics and highlights voter commitment leading into Election Day. In this analysis, we’ll also compare these pre-election insights to the actual voter turnout results to understand how well predicted trends aligned with reality.
General
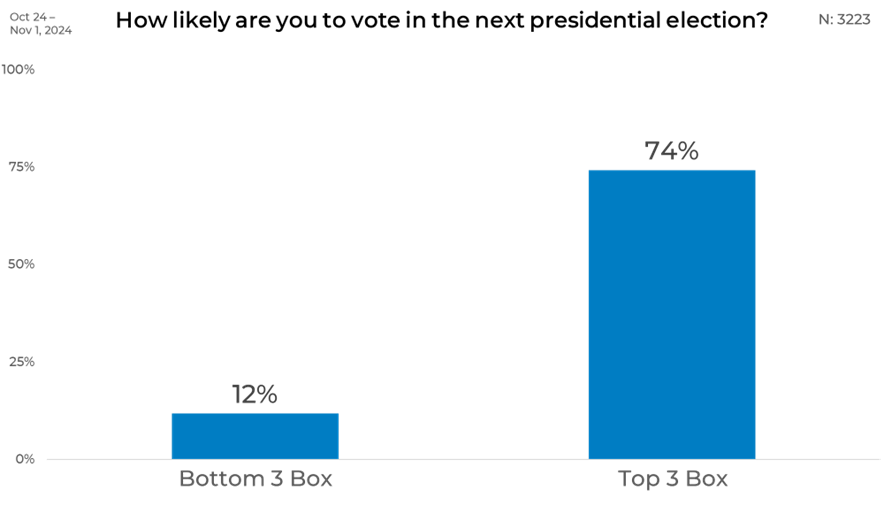
A striking majority of respondents leaned toward voting, with 74% selecting a top-box score on a 10-point scale, indicating a strong likelihood of participation. Only 12% placed themselves in the bottom three, suggesting low or no likelihood of voting. This data underscored a potential for high turnout, with voter enthusiasm significantly outpacing disinterest.
Gender
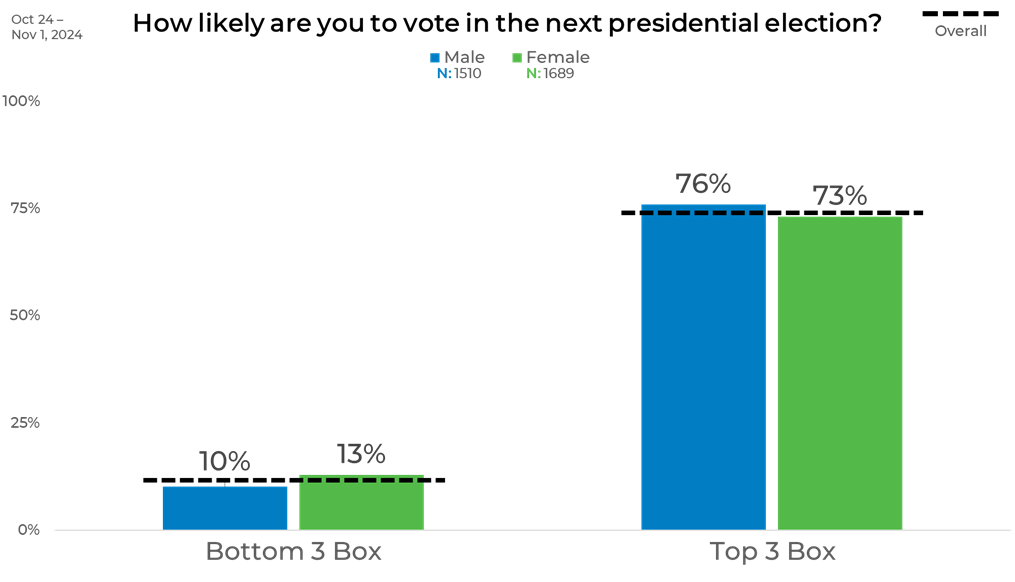
A striking majority of respondents leaned toward voting, with 74% selecting a top-box score on a 10-point scale, indicating a strong likelihood of participation. Only 12% placed themselves in the bottom three, suggesting low or no likelihood of voting. This data underscored a potential for high turnout, with voter enthusiasm significantly outpacing disinterest.
Political Affiliation
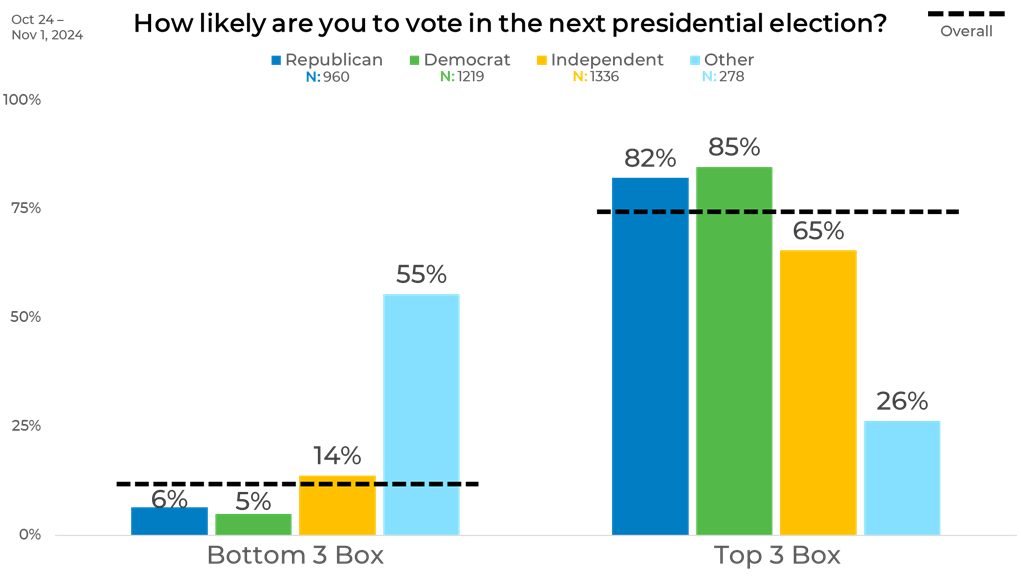
Political affiliation showed significant variation in voting intent. Democrats (85%) and Republicans (82%) displayed the highest commitment, with disinterest levels as low as 5% and 6%, respectively. Independents, at 65% in the top three, demonstrated moderate engagement. This data underscored the strong partisan drive among major parties, contrasting with the relatively lower motivation of non-affiliated respondents.
Age
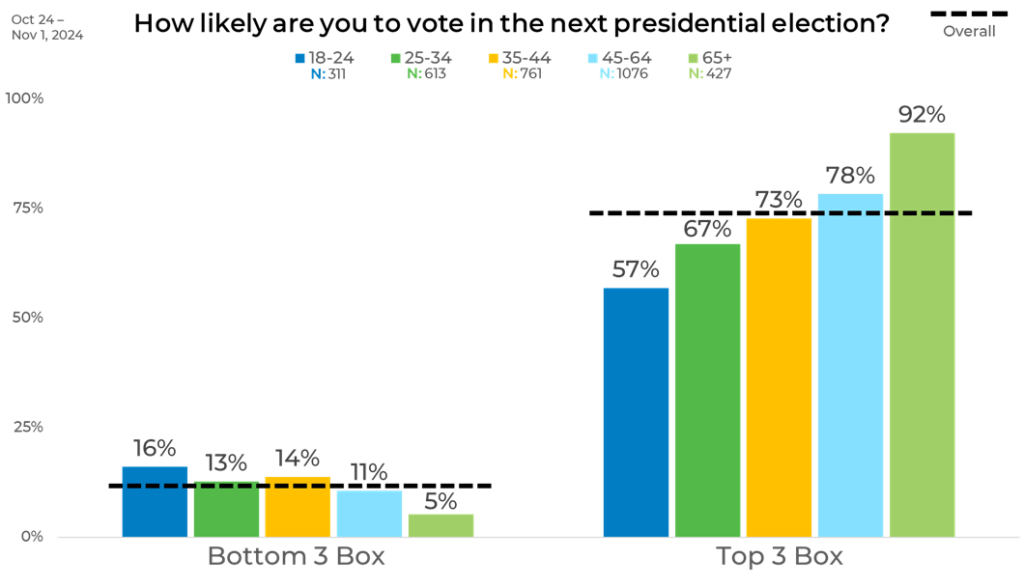
Age presented a clear divide in voter turnout likelihood. Seniors (65 and older) showed the highest commitment, with 92% selecting a top-box score and just 5% indicating low interest. Conversely, young voters (18-24) demonstrated the least commitment, with only 57% in the top three boxes and 16% in the bottom three, signaling the highest disinterest rate among age groups. The intent to vote increased progressively with age, suggesting that older Americans were the most driven to participate in the election.
Panels
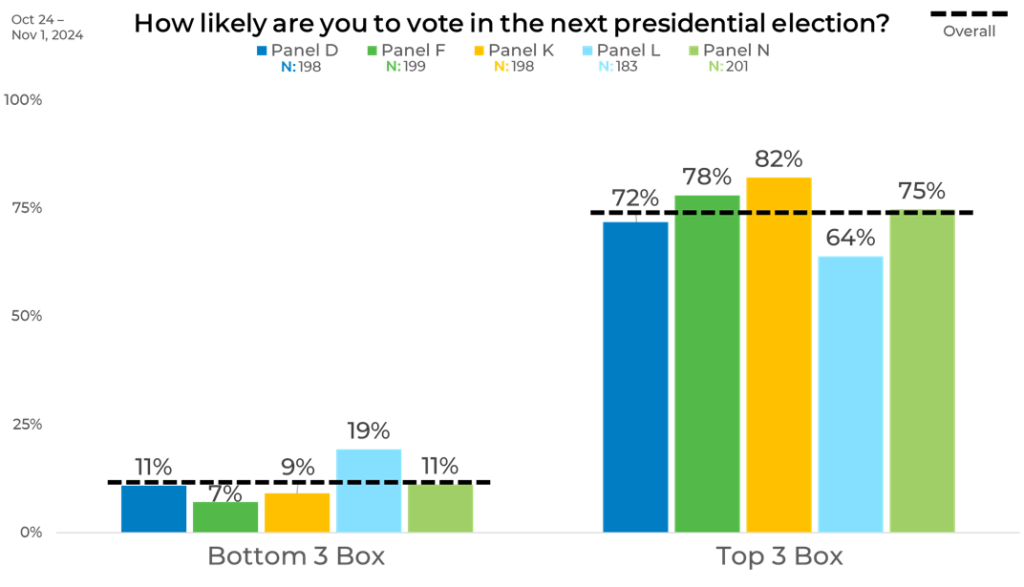
Panel enthusiasm varied, with Panel K leading at 82% in the top three and only 9% in the bottom three. Panel F followed with 78% top-box responses and the lowest disinterest rate at 7%. Panel L showed the lowest voter intent, with just 64% in the top three and a high 19% in the bottom three. Panels D and N exhibited moderate enthusiasm, with 72% and 75% in the top box and 11% in the bottom, respectively. This illustrated how panel composition affected engagement, with Panel K showing the highest motivation and Panel L the least.
Post-Election Comparison
Comparing this pre-election data to the actual voter turnout in 2024, the results aligned closely with the projections of high turnout among committed groups. According reports by The Washington Post, Voter turnout was at 64.5%, just short of the record set in 2020. Our research indicates that 74% of Americans voted that they were likely to vote, marking a top three box out of ten, with 61% of respondents voting the top box, indicating incredibly accurate predictions.
The pre-election analysis accurately predicted key trends seen on Election Day percentage wise, but also indicated strong participation among older voters and committed partisans, with lower engagement from younger and non-affiliated voters. This reinforces the importance of assessing voter intent to forecast turnout and potential outcomes.
At EMI, we prioritize quality sampling to provide reliable insights that mirror real-world behaviors and trends.


