Top Voter Priorities: Economy vs. Social Issues in the Upcoming Election
October 31, 2024How Confident Are Voters? Insights on the 2024 Election Choices
November 4, 2024A Closer Look at 2024 Election Preferences by Demographic
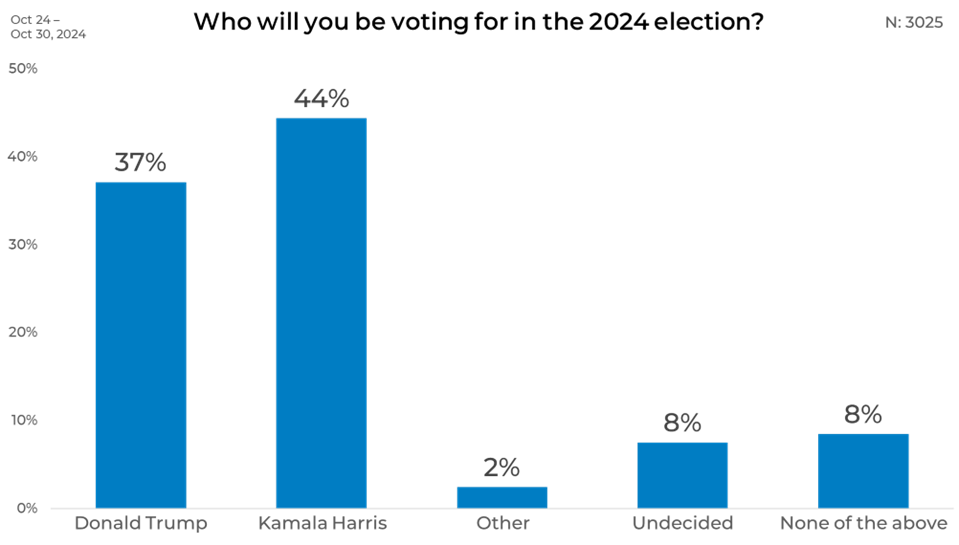
As the 2024 election approaches tomorrow, the latest data on voter preference shows a tight race with notable levels of undecided and disenchanted voters. Currently, 44% of respondents plan to vote for Kamala Harris, placing her ahead of Donald Trump, who holds 37% support. However, 8% remain undecided, representing a significant group that could sway the outcome. Another 8% indicate they won’t support any listed candidate, highlighting a segment of voters still searching for a compelling option. These numbers offer a real-time view into the evolving voter landscape, underscoring potential shifts that could tip the balance as polls open.
General
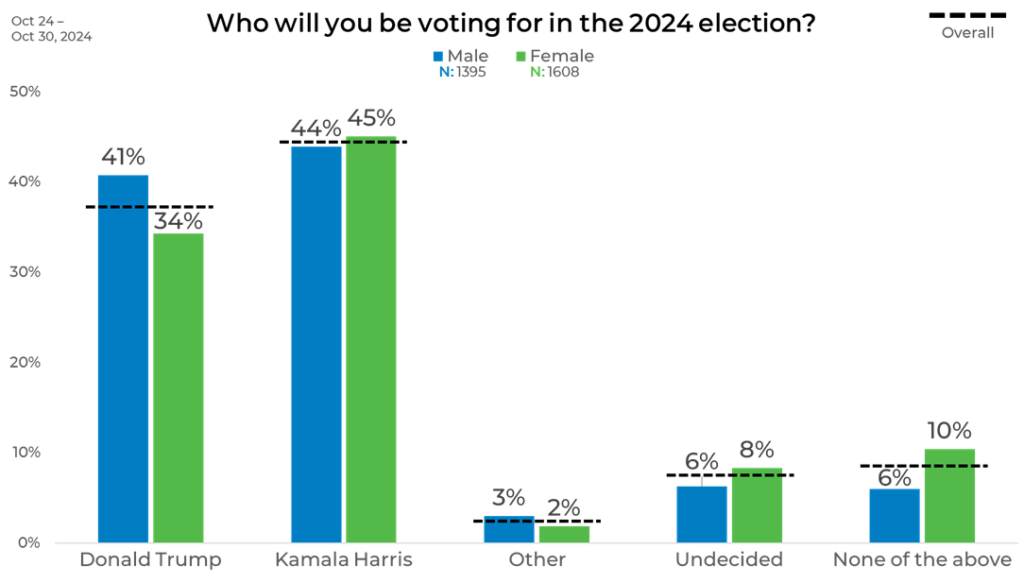
Gender plays a significant role in candidate preference, with Donald Trump receiving more support from male respondents (41%) than from female respondents (34%). Kamala Harris holds steady support across genders, with slightly higher backing from female respondents (45%) compared to males (44%). Additionally, more women (10%) than men (6%) express a preference for “None of the above,” reflecting a slightly higher level of disenchantment among female voters. While Harris holds the lead among both genders, male respondents show a greater inclination toward Trump, and female respondents are more likely to feel uncertain or dissatisfied with the current choices.
Gender
Gender plays a significant role in candidate preference, with Donald Trump receiving more support from male respondents (41%) than from female respondents (34%). Kamala Harris holds steady support across genders, with slightly higher backing from female respondents (45%) compared to males (44%). Additionally, more women (10%) than men (6%) express a preference for “None of the above,” reflecting a slightly higher level of disenchantment among female voters. While Harris holds the lead among both genders, male respondents show a greater inclination toward Trump, and female respondents are more likely to feel uncertain or dissatisfied with the current choices.
Political Affiliation
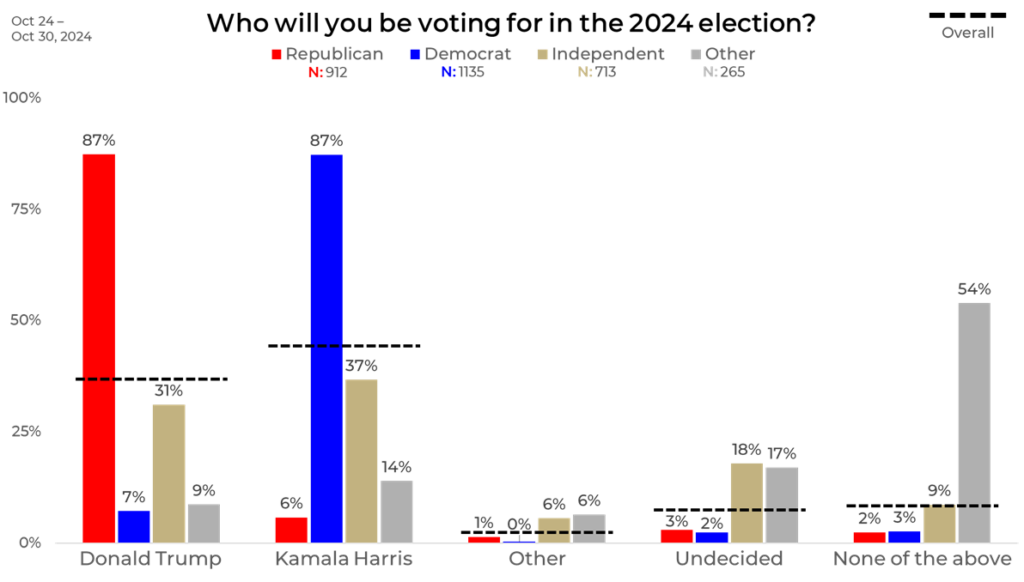
Political affiliation significantly shapes voter preferences. Among Republicans, Donald Trump has overwhelming support at 87%, whereas Kamala Harris leads similarly among Democrats with 87% backing. Independents lean toward Harris (37%) while still giving Trump notable support (31%), reflecting a split preference within this group. Independents and “Other” respondents show the highest undecided rates, at 18% and 17%, respectively, while “Other” respondents also show a preference for “None of the above” at 54%. This indicates a substantial portion of non-affiliated voters are dissatisfied with the main candidates, highlighting their potential influence on the election outcome should they coalesce around an alternative option.
Age
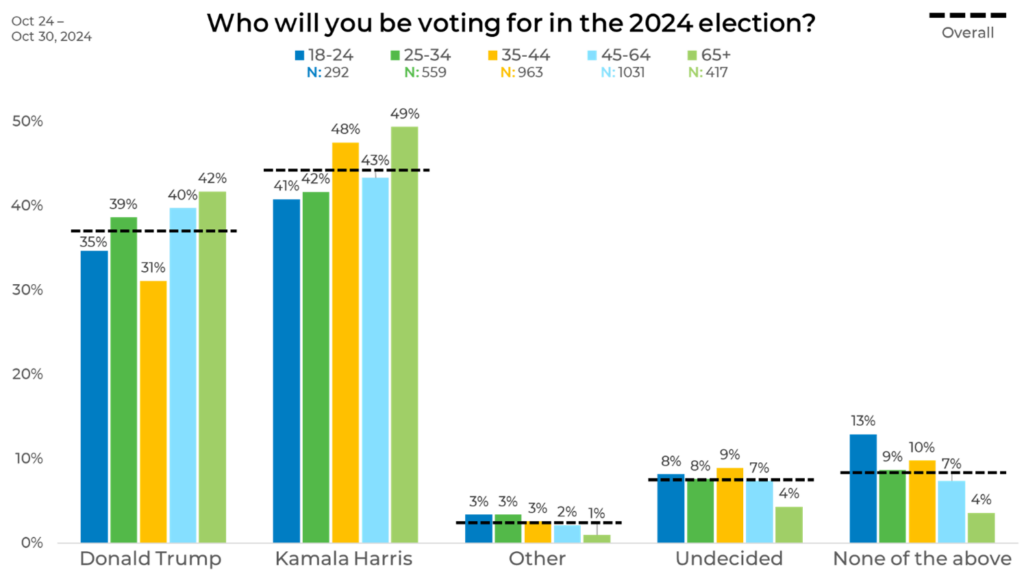
The age breakdown reveals differences in candidate support across generations. Kamala Harris leads across all age groups, especially among those aged 35-44 (48%) and 65+ (49%). Trump’s support is strongest among older voters, reaching 42% in the 65+ group, and 40% among those 45-64, with a notable drop to 31% among respondents aged 35-44. Younger voters (18-24) are most likely to choose “None of the above” (13%), indicating greater dissatisfaction among the youngest demographic. While Harris has stronger appeal among younger and middle-aged voters, Trump has higher support among older respondents, with younger voters showing more dissatisfaction and indecision.
Income
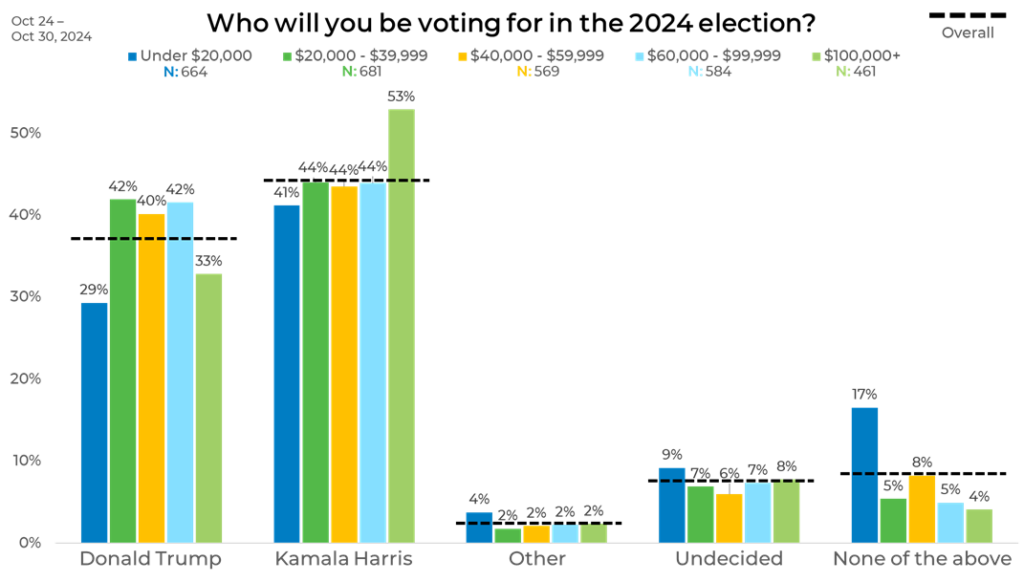
The income breakdown provides insight into candidate preference across economic groups. Kamala Harris’s support is highest among respondents earning $100,000+ (53%) and lowest among those earning under $20,000 (41%). In contrast, Trump receives more support from middle-income groups, with his support peaking at 42% among those earning $20,000-$99,999, while dipping to 29% in the lowest income bracket and 33% among the highest earners. Lower-income respondents (under $20,000) are more inclined to select “None of the above” (17%), suggesting a higher level of disenchantment within this group. Overall, Harris’s appeal appears to rise with income, whereas Trump’s support remains stable across lower and middle-income levels, with dissatisfaction notably higher among lower-income voters.
Ethnicity
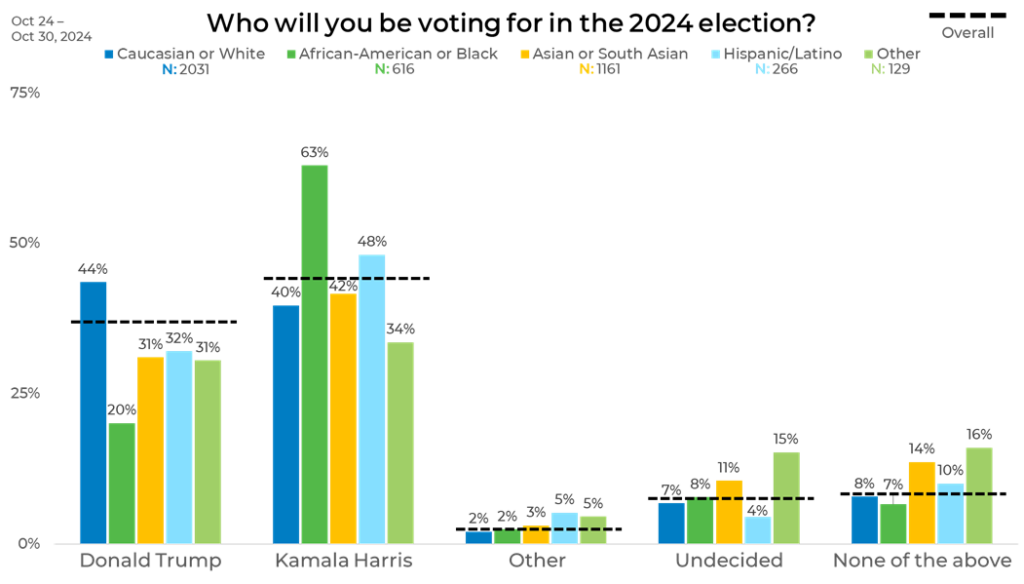
Ethnicity reveals distinct voting trends, with Kamala Harris receiving strong support from African-American respondents (63%) and considerable backing among Hispanic/Latino (48%) and Asian/South Asian (42%) voters. Trump’s highest support comes from Caucasian respondents (44%), with lower backing from African-American voters (20%). The “None of the above” and undecided categories show higher levels among Asian/South Asian respondents, at 14% and 11%, respectively, reflecting a degree of dissatisfaction or indecision within these groups. Harris’s lead is solidified by strong support from African-American and Hispanic/Latino respondents, while Trump’s primary support comes from Caucasian voters, with minority groups displaying some ambivalence.
Panels
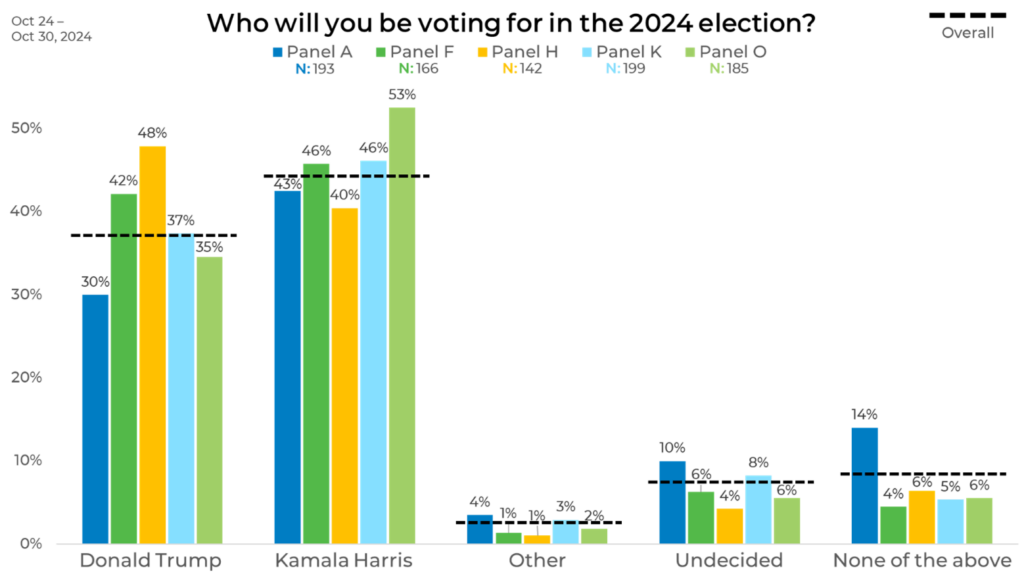
A breakdown by panel reveals further nuances in support for the candidates. Kamala Harris receives the highest support in Panel O (53%) and also performs well in Panels F and K (46% each). Donald Trump’s strongest backing is seen in Panel H (48%) and Panel F (42%). Panel A exhibits the highest percentage of respondents choosing “None of the above” (14%), indicating more dissatisfaction within this group. The undecided percentages are relatively low across panels, with Panel H having the fewest undecided respondents at 4%. These results suggest Harris has a slight edge in most panels, while Trump has concentrated support in a few, especially Panel H, with some panels showing notable openness to alternatives or undecided positions.
This breakdown of voter preferences across demographics provides a snapshot of where voters stand and highlights areas of uncertainty or dissatisfaction among key groups. As the election approaches, undecided and disenchanted voters may significantly influence outcomes, especially within demographics that exhibit less alignment with the leading candidates. This data underscores the importance of continued analysis to understand how these segments may impact the final results.
This Panel breakdown is an excellent representation of where quality data sampling matters. At EMI, we prioritize strategically blending sample sources to balance demographics as well as behaviors and attitudes to ensure that we provide the most representative and accurate data. Download The Sample Landscape: 2024 Edition to better understand how panels differ from one another and how they impact your data.


