
Blades of Joy: Unveiling the Passion for Ice Skating
December 27, 2023
Grading Our 2023 MRX Predictions
January 12, 2024Since the Fall, many companies have announced changes to their work-from-home or hybrid work policies. Most of the changes required employees to be back in the office more.
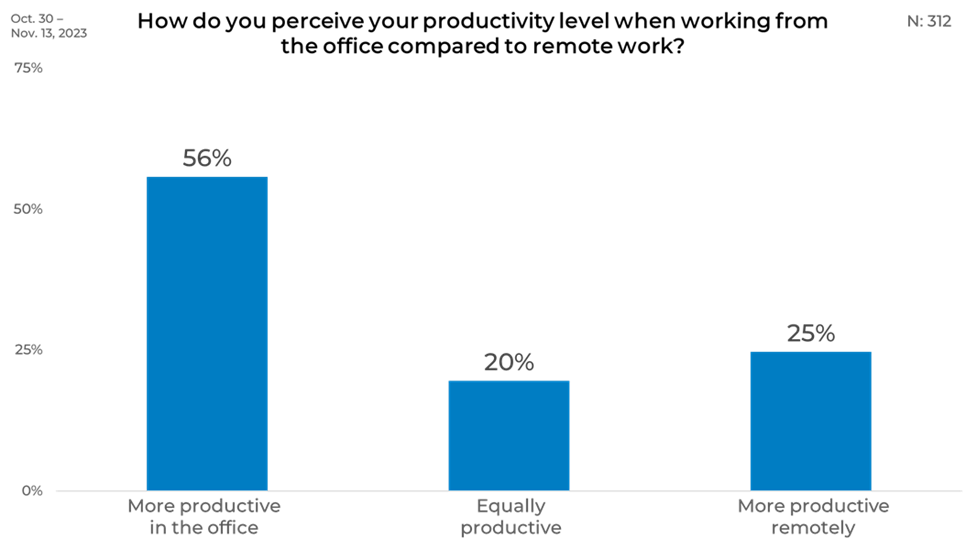
In our recent round of research-on-research, we wanted to understand people’s views on their productivity. Our survey focused on individuals with office work experience, asking them to evaluate their productivity across different work settings. We aimed to capture a straightforward understanding of their preferences—whether they find themselves more productive in the office environment or feel they can achieve the same efficiency while working remotely. Overall, we found that 56% of those surveyed find themselves more productive in an office setting. This rate is 31% higher than those who feel they excel in a remote work environment. This shows a clear majority favoring the structure and resources an office can provide. Additionally, it’s notable that a consistent 20% of workers report no difference in productivity between the office and remote settings, indicating a significant portion of the workforce is adaptable to either scenario.
Gender
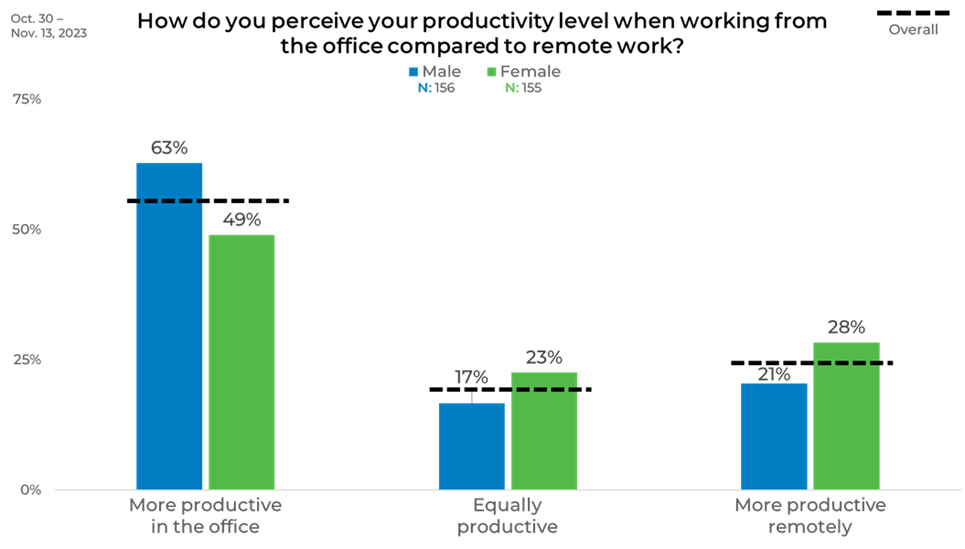
When looking at opinions on productivity by gender, we observe noteworthy differences. Male respondents lean towards the office for their productivity, with a significant 63% noting they are more productive in this environment, a 14% increase over their female counterparts. In contrast, female respondents exhibit a more distributed approach to productivity. They are 6% more likely to find themselves equally productive in either setting and 7% more likely to feel more productive when working remotely than males.
Age
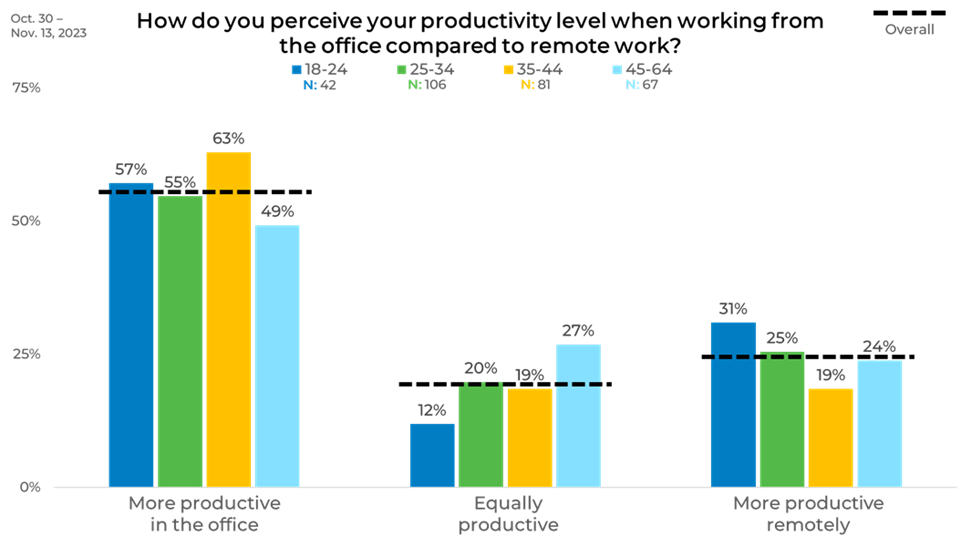
Age influences workplace productivity preferences distinctively. The 35-44-year-old age bracket stands out, with 63% favoring the office for productivity, notably higher than other age groups, and 14% more than the 45-64 age group. Conversely, those aged 45-64 are most adaptable, with a significant portion finding themselves equally productive in either setting, surpassing the youngest group (18-24) by 15%. For remote work, the 18–24-year-olds lead the way, outpacing the 35-44 age group by 12%.
Income
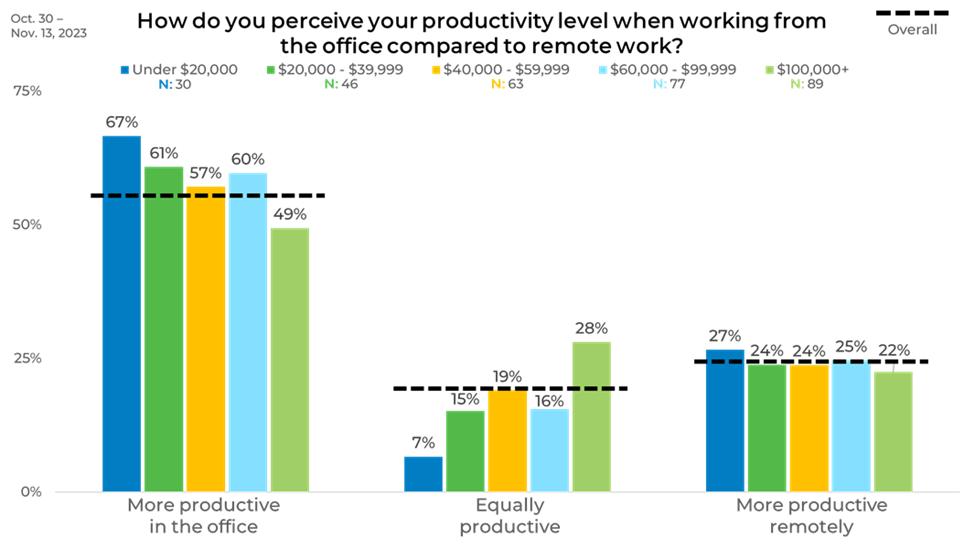
When breaking down the results by income level, we noticed a pattern. Individuals earning under $20,000 a year report the highest likelihood of being more productive in the office, at 67%. Generally, as income increases, the preference for office productivity declines. However, this trend halts in the $60,000 – $99,999 income bracket, which doesn’t follow the pattern. Those with incomes above $100,000 are most versatile, with a 21% higher likelihood of being equally productive in either environment than those in the under $20,000 bracket.
Political Affiliation
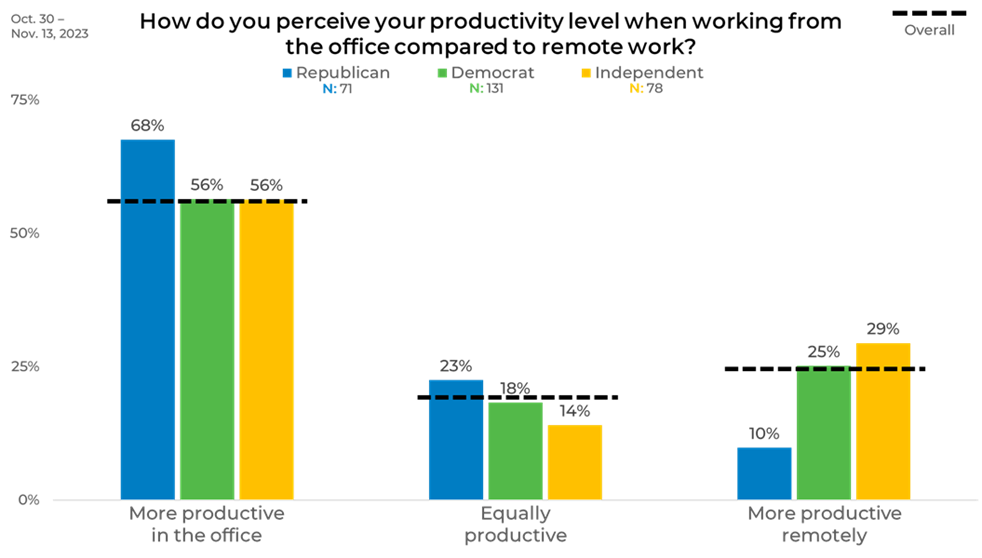
Some patterns reveal themselves when looking at productivity preferences by political affiliation. Republicans are predominantly office-oriented, with 68% reporting higher productivity in a traditional work setting. Democrats and Independents are equally likely to prefer office productivity. However, regarding remote work, Independents take the lead—29% feel they are more productive remotely, significantly surpassing Republicans who are less inclined towards remote work.
Ethnicity
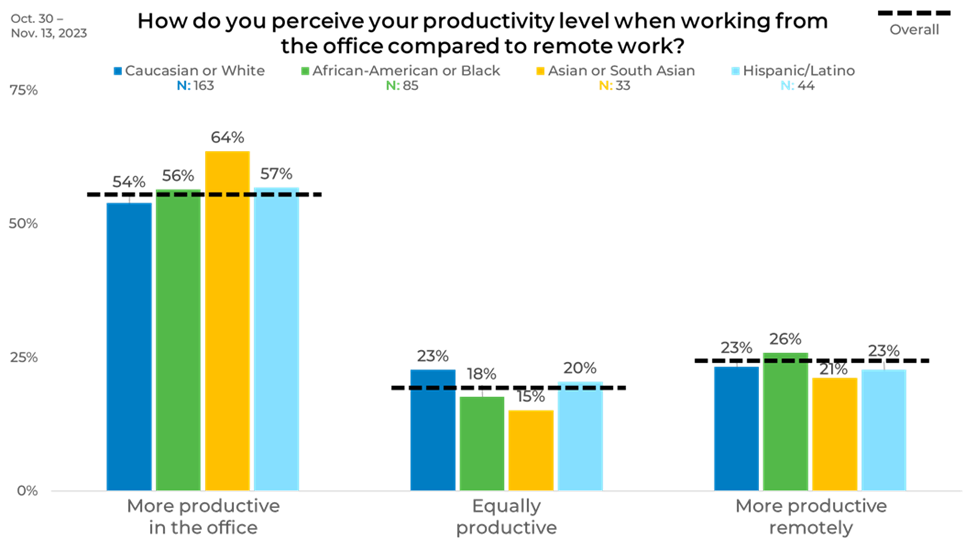
We next took a look at productivity preferences by ethnicity. Asians or South Asians report the highest office productivity at 64%, a 7% lead over the next closest group, Hispanics/Latinos. Caucasians top the charts for adaptability, with 23% stating equal productivity in both settings. Meanwhile, African Americans are at the forefront of remote work productivity, edging out other ethnicities by 3%.
Region
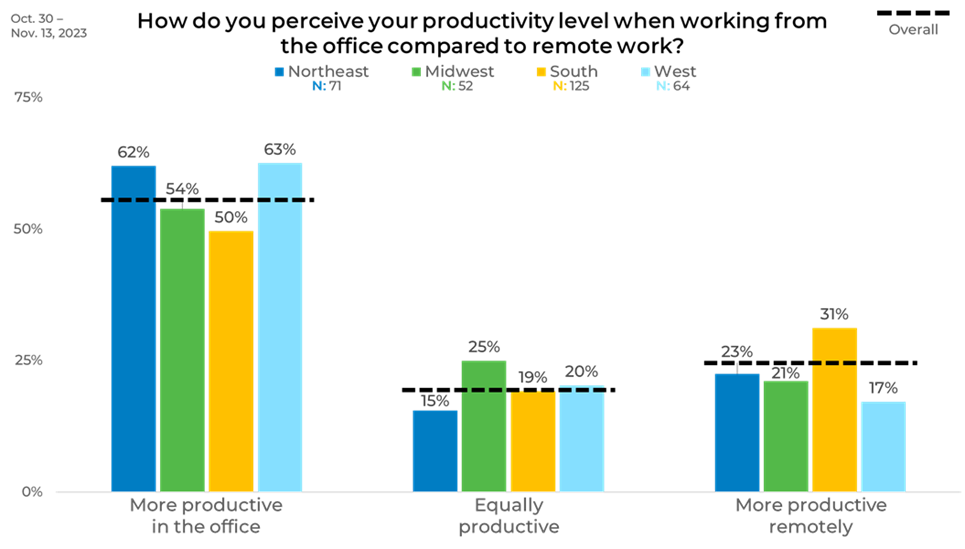
Regionally, productivity perceptions vary significantly. In the office, the West leads with 63% feeling more productive, closely followed by the Northeast. The South trails at 50%, making them the least likely to favor office productivity. Conversely, the Midwest stands out for balanced productivity, with 25% feeling equally productive regardless of location, a full one out of every four people. Yet, when it comes to remote work, the South shifts to the forefront, with 31% feeling more productive, surpassing other regions by at least 8%.
Panel
The disparity in preferences between panels is particularly striking when comparing Panel D to Panel E, where there is a 34% gap in the preference for office-based productivity. While Panel D respondents predominantly favor the office setting for their productive work hours, Panel E members demonstrate a more even productivity distribution across various work environments. They have a mild preference for the office yet the slightest difference in productivity perception between working locations.
AI tools significantly enhance productivity both at home and in the office by automating manual and repetitive tasks, allowing individuals to focus on more complex and creative work. This technological advancement not only increases efficiency but also improves the quality of work. In particular, generative AI has shown to double productivity in specific tasks, especially those that are complex and cognitively demanding. Furthermore, AI future tools help bridge the gap between the most and least skilled workers, making it easier for everyone to achieve better results. However, the extent of productivity gains varies across different professions and tasks, depending on how suitable they are for AI support. For UX professionals, for example, productivity could potentially double for tasks that are amenable to AI, though not all tasks will benefit equally. The quality of work also tends to improve with AI assistance, as seen in business document writing, where drafts produced with AI help received higher quality ratings due to more time being available for editing.
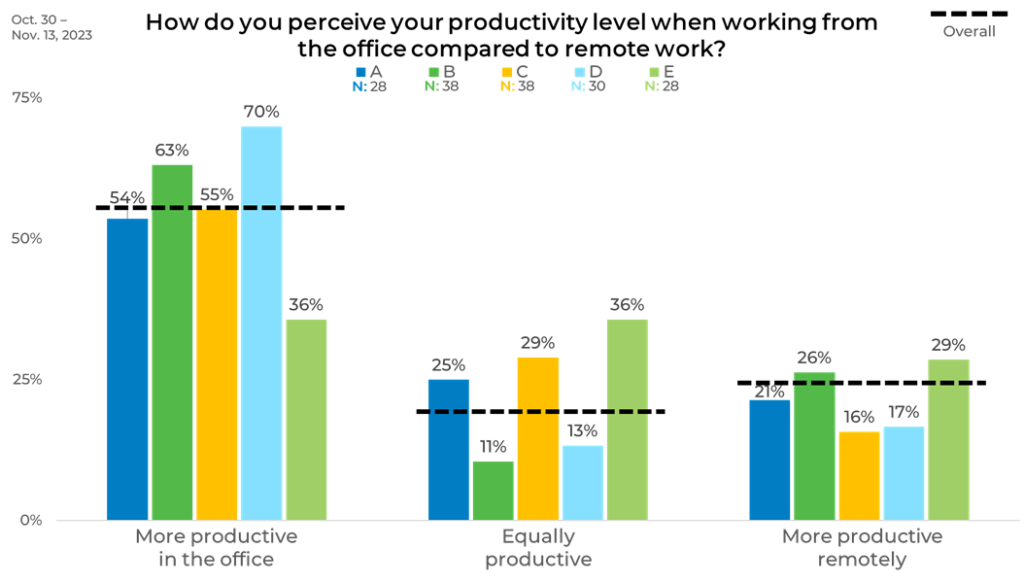
As you can see, attitudes and preferences can vary significantly across demographics and by panel, impacting your data. That is why strategically blending sample is the best practice to ensure you are accounting for demographic balance and attitudinal and behavioral as well.
Learn more about panel differences in our annual report on the sample industry, The Sample Landscape: 2023 Edition.


