
Intellicast S6E16– A Slow News Week
June 9, 2023
Don’t Judge Us! Unpopular Opinions in Consumer Behavior
June 28, 2023Father’s Day is this Sunday! With the holiday right around the corner, we asked people if they plan to celebrate Father’s Day this year in our latest round of research-on-research.
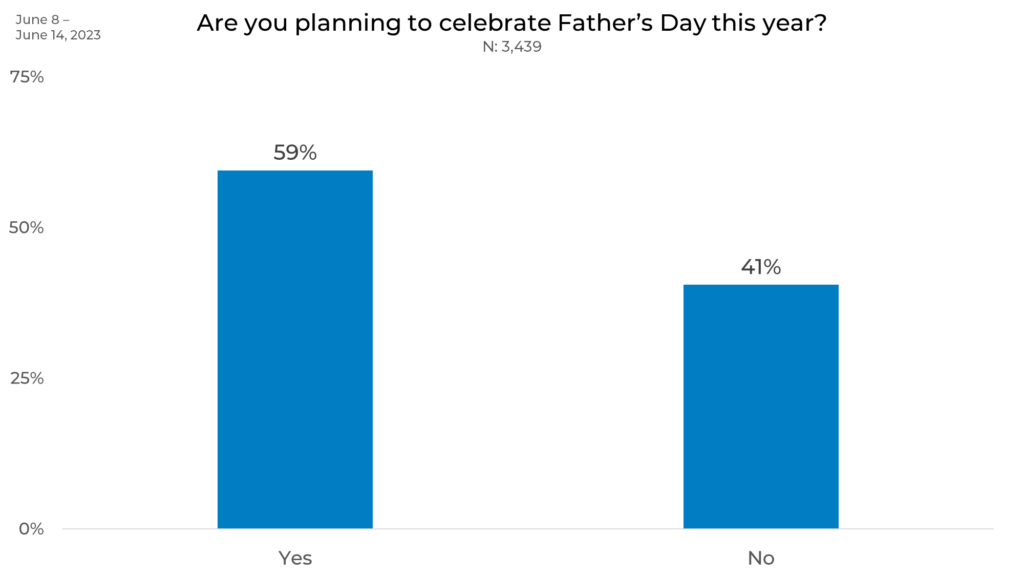
Overall, the majority of people (59%) are planning to celebrate Father’s Day.
Political Affiliation
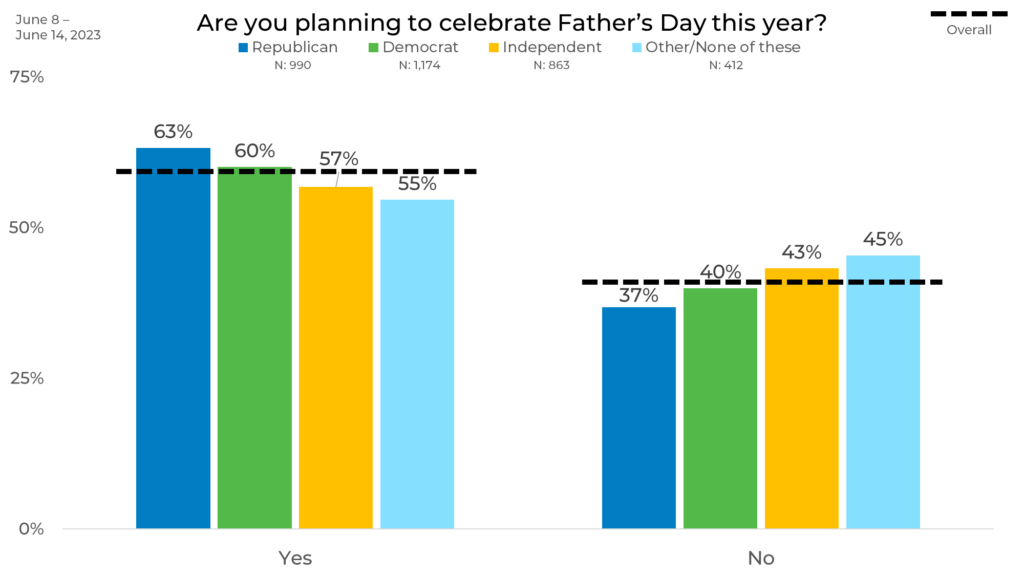
When it comes to political affiliation, we see that Republicans are the most likely to celebrate Father’s Day. People who responded Other/None of these for their political affiliation are the least likely to celebrate Father’s Day this year (8% less likely than Republicans.)
Ethnicity
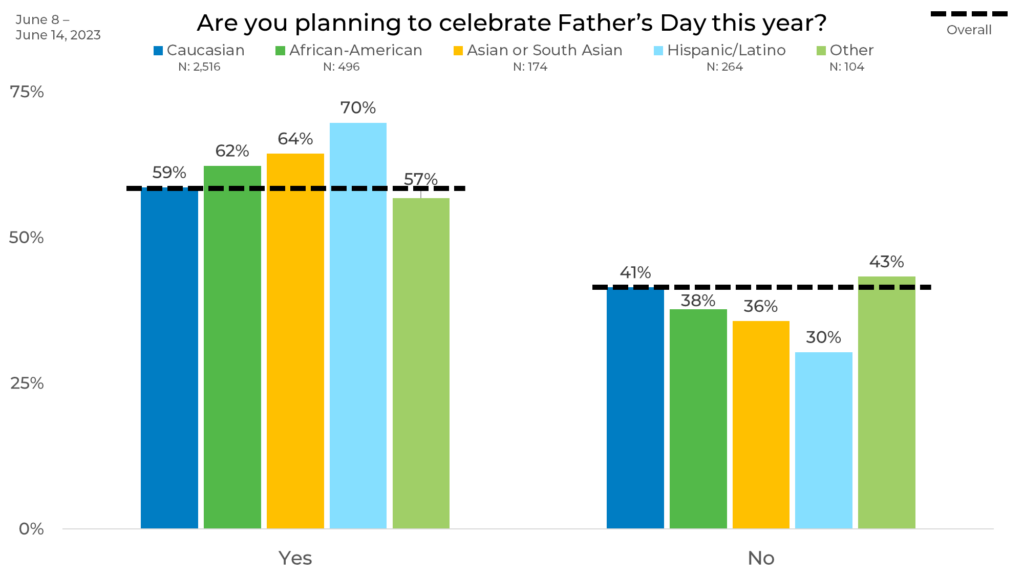
We also looked at response by ethnicity. Here we found that Hispanic/Latino respondents are the most likely to celebrate Father’s Day at 70% (6% higher than any other ethnicity.) Asian or South Asian respondents are the second most-likely at 64% followed by African Americans, Caucasians, and those who identify as “Other,” respectively.
Age
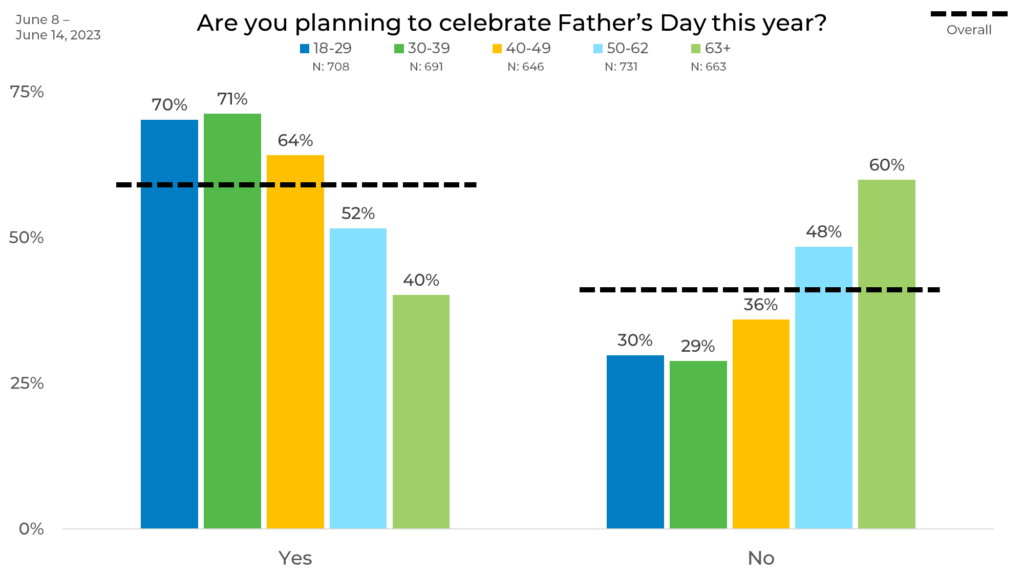
When it comes to age, we find that the older a person is, the less likely they are to celebrate Father’s Day. People aged 18-29 and 30-39 are the most likely to celebrate Father’s Day at ~70% (30% more likely than people over the age of 63.)
People over the age of 63 are the least likely to celebrate Father’s Day at 39%. They are the only age group where the majority do not plan to celebrate.
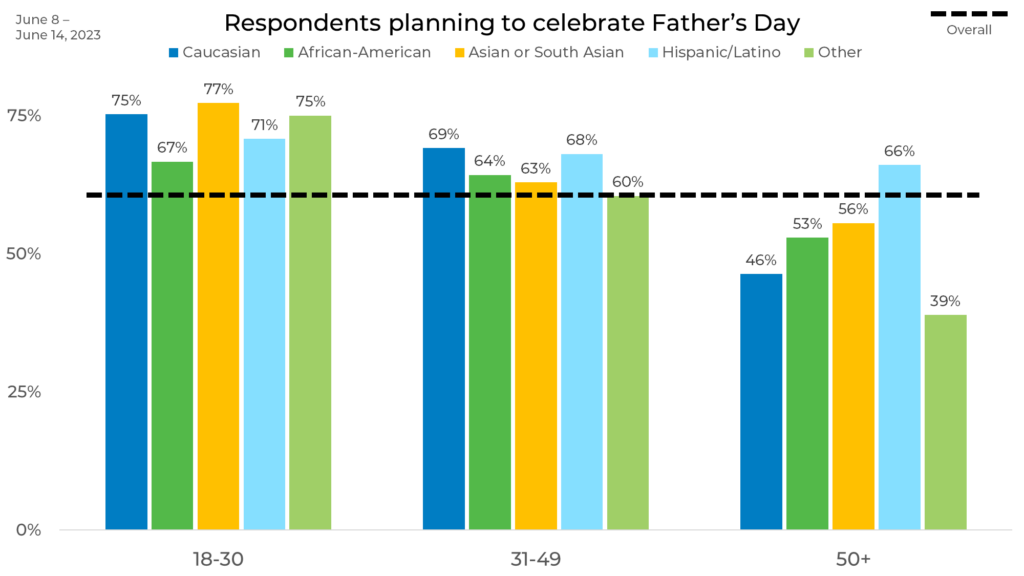
If we take a closer look at responses by age and ethnicity, we see that Hispanic/Latino respondents have the least amount of variance through the age groups with only a 5% difference between the 18-30 age group and 50+ age group. However, every other ethnicity has at least a 14% difference between the 18-30 and 50+ age groups.
For respondents that are age 50+, Hispanic/Latino respondents are 10% more likely than any other ethnicity to celebrate.
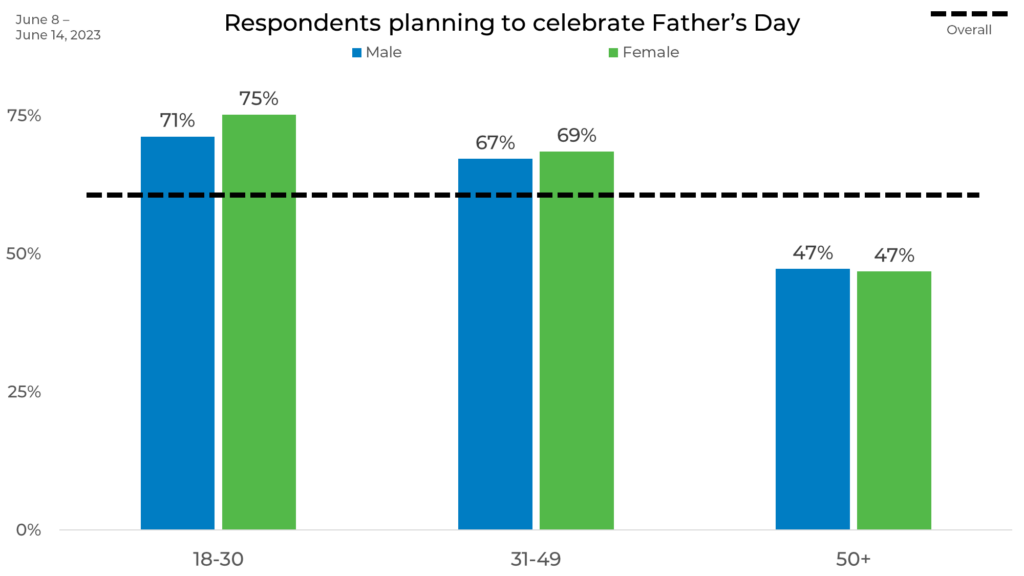
We also took a deeper dive by age and gender. As respondents get older, the gap between the two closes. In the 18-30 age range, females are 4% more likely to celebrate than males. In the 31-49 age group, females are 2% more likely to celebrate than males. In the 50+ age range, likelihood to celebrate Father’s Day is equal between females and males at 47%.
Income
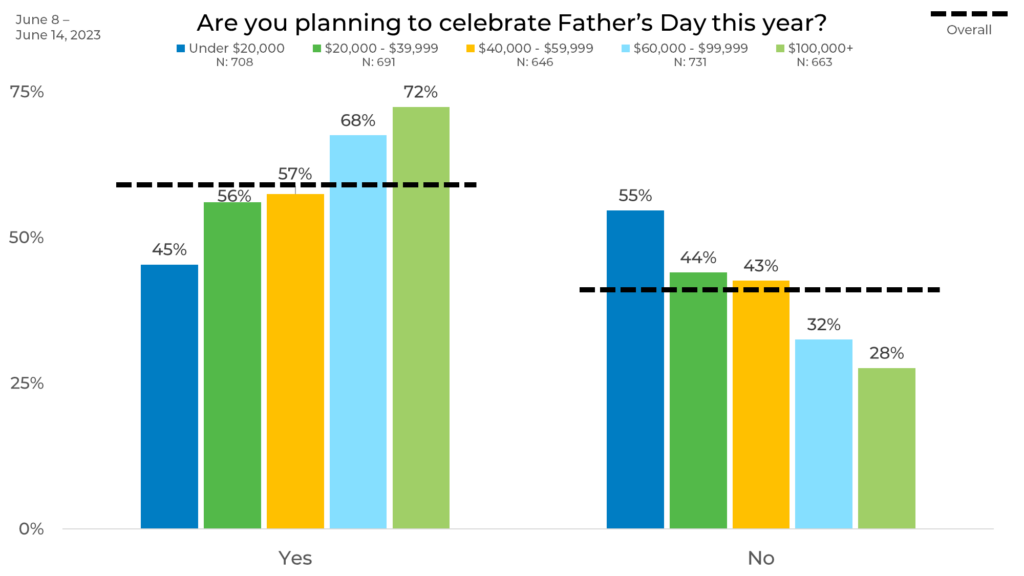
When comparing responses by income, we see that the higher a person’s income, the more likely they are to celebrate Father’s Day. In fact, people with incomes above $100,000 are 27% more likely to celebrate than those with incomes under $19,999. People with incomes above $60,000 are above the overall average of those who plan to celebrate, whereas for those with incomes below $60,000 the opposite is true. This may be because people with higher incomes have more disposable income to spend on celebrations or may have more standard working hours that allow them time to celebrate.
Panel
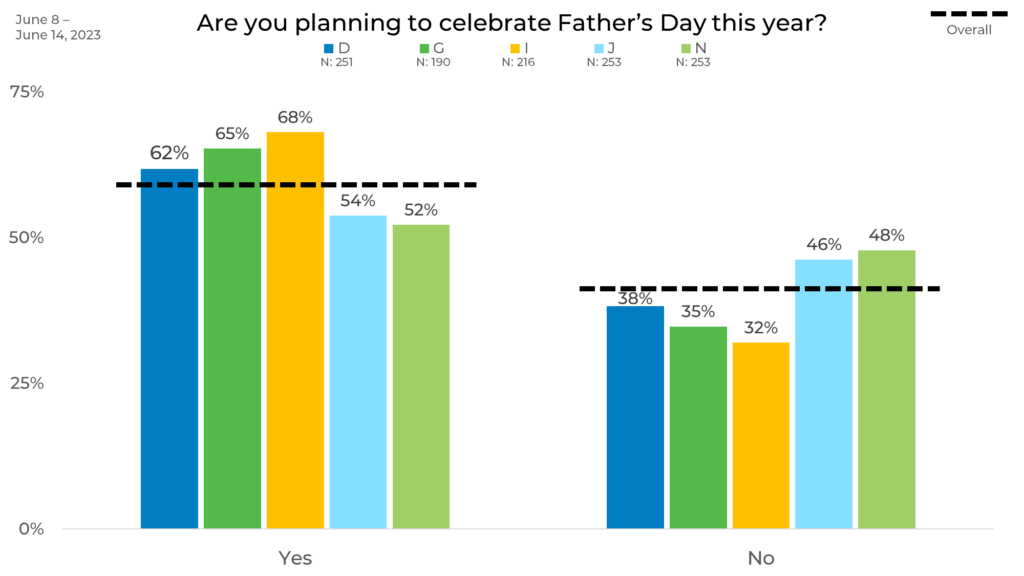
Finally, we looked at responses by panel. Here we see up to a 16-percentage-point difference between panels in those who plan to celebrate Father’s Day. We also see differences up to 9 percentage points higher and 7 percentage points lower than the overall average by panel. These variations can be due to differences in panel makeup, management, incentive, and more.
Consumer behaviors and attitudes can vary greatly by both demographic and panel which can have a significant impact on your data. For example, if someone used only Panel I for their research, they might think more people celebrate Father’s Day than actually do. This could be due to the fact that Panel I might have younger respondents, or has a higher Hispanic population, both groups we know are more likely to say they are planning to celebrate Father’s Day.
Needless to say, but all panels are different—this is why strategic sample blending is the best practice to ensure any changes in your data are due to shifts in the market, not inconsistencies in your data.
Happy Father’s Day to all the dads out there and everyone who plans to celebrate!
To learn more about our research-on-research, check out The Sample Landscape: 2023 Edition!


