Intellicast S5E12: EPC: Do We Need To Change How We Price?
March 28, 2022
Intellicast S5E13: April MRX Conference Preview
April 1, 2022Spring officially sprung last week (though the Midwest has yet to make up its mind weather-wise.) However, we wanted to know what people thought of winter in general. In our latest wave of research-on-research, we asked respondents how they felt about winter. Here is what we found:
Overall
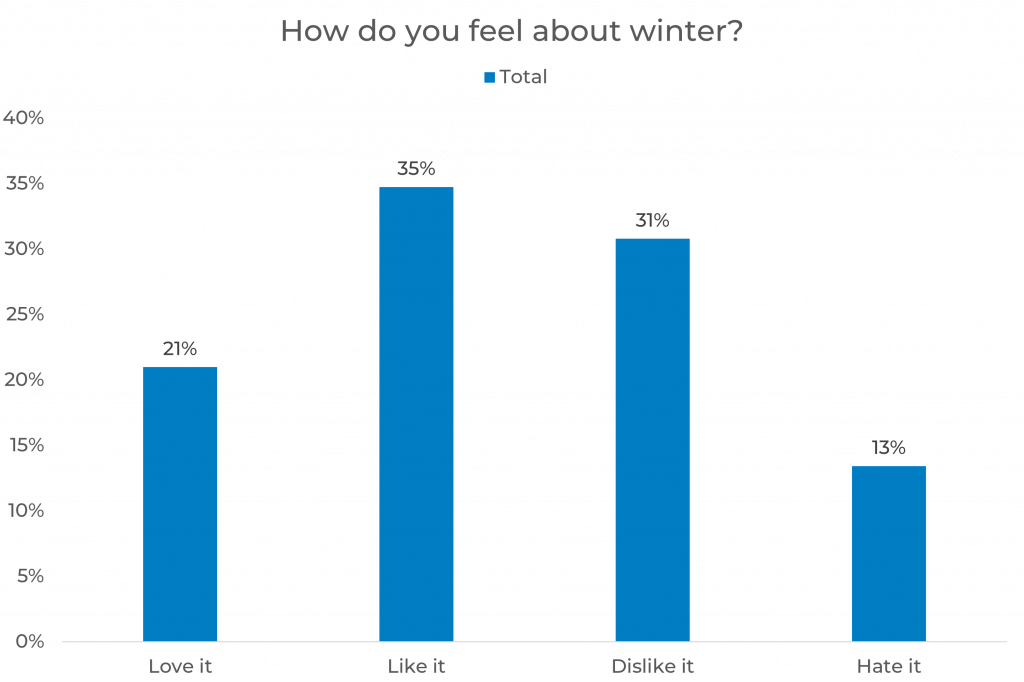
Overall, most people tend to enjoy winter, with 56% of respondents saying they either like or love winter. Only 13% of people say they hate winter.
Region
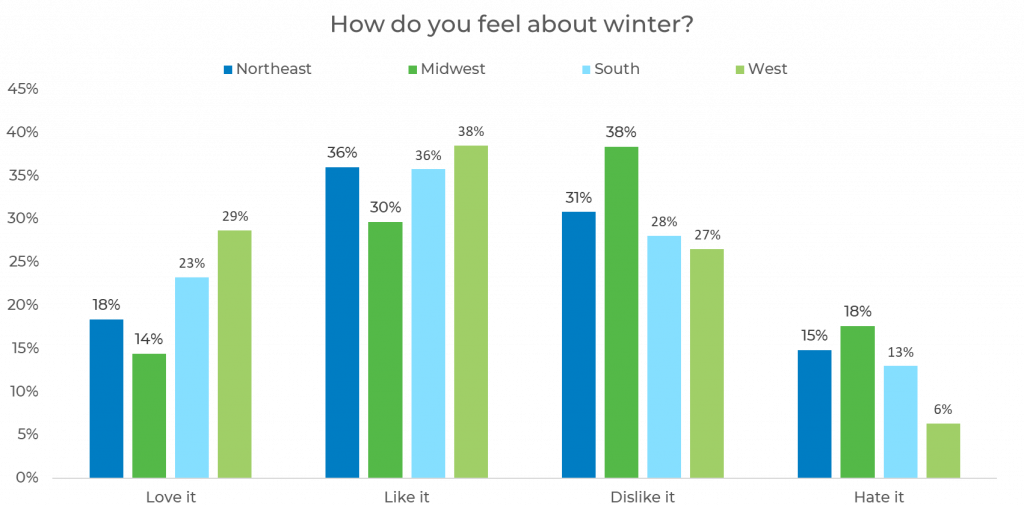
We looked at how respondents felt about winter by region and found that people who live in the West are most likely to feel favorably about winter followed by those in the South, the Northeast, and the Midwest, respectively. People in the Midwest were most likely to feel negatively about winter with 56% saying they either dislike or hate winter. Not surprisingly, 67% of people in the South either like or love winter, probably due to more moderate climates in the winter months than climates in other regions during that time.
Age
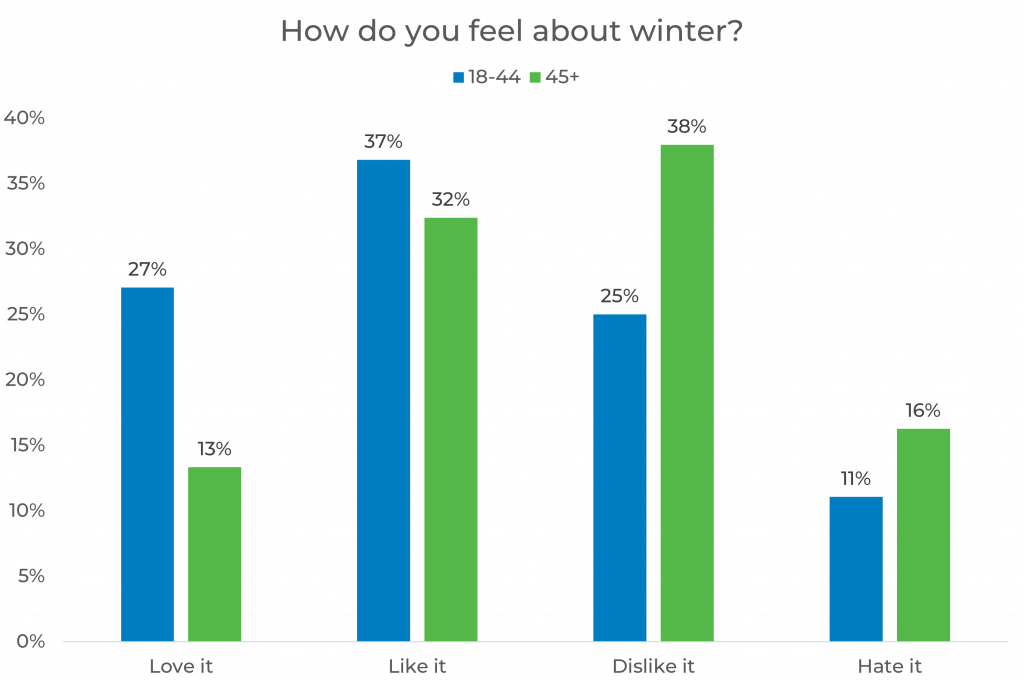
When looking at perceptions by age, those age 18 to 44 are more likely to feel favorably about winter than those age 45+. This may be because cold weather can create greater risks for those who are older.
Gender
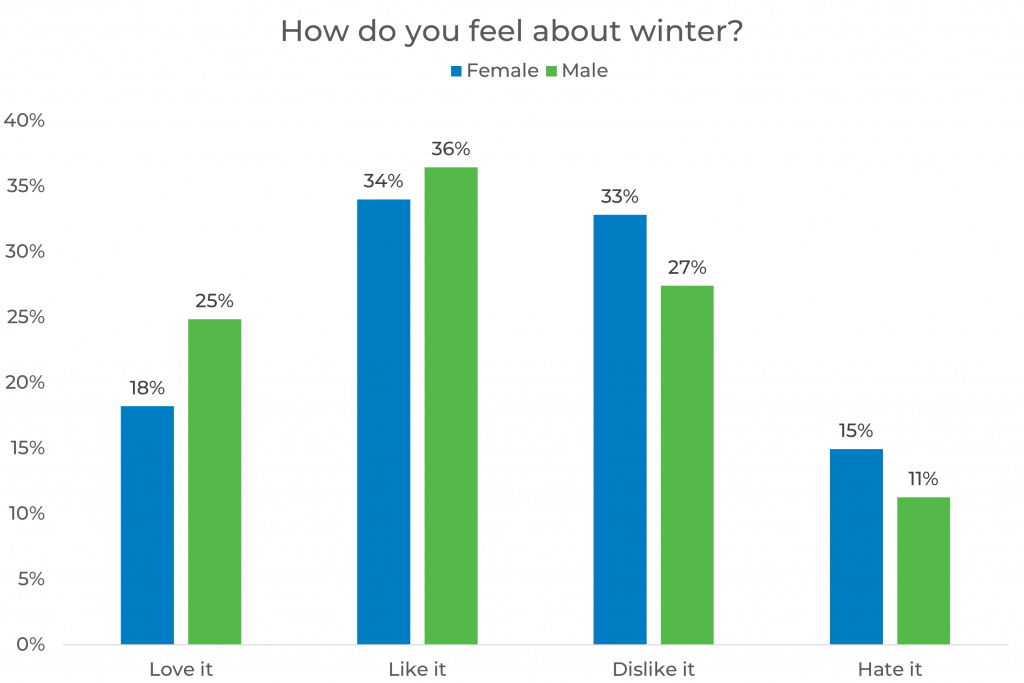
When looking at public perceptions of winter by gender, males are more likely than females to feel favorably about winter. Males are 7% more likely to love winter than females, while females are 5% more likely to dislike winter and 4% more likely to hate it than males.
Political Affiliation
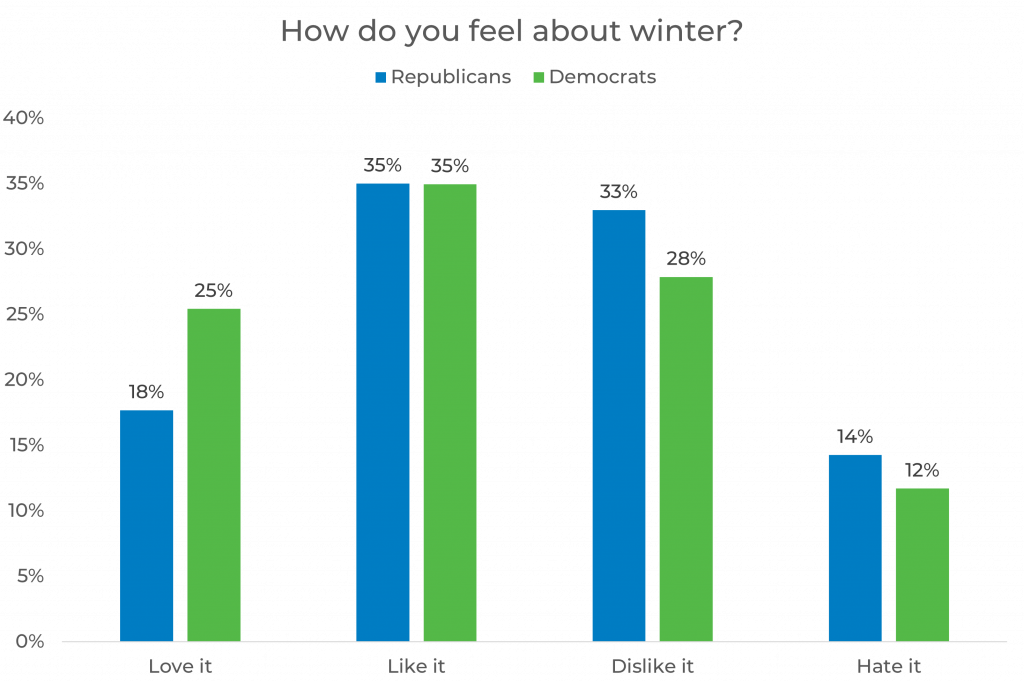
When it comes to Political Affiliation, Democrats tend to feel more favorably about winter than Republicans. Democrats were 7% more likely than Republicans to say they love winter, while Republicans were 5% more likely to say they dislike it and 2% more likely than Democrats to say they hate it.
Panel
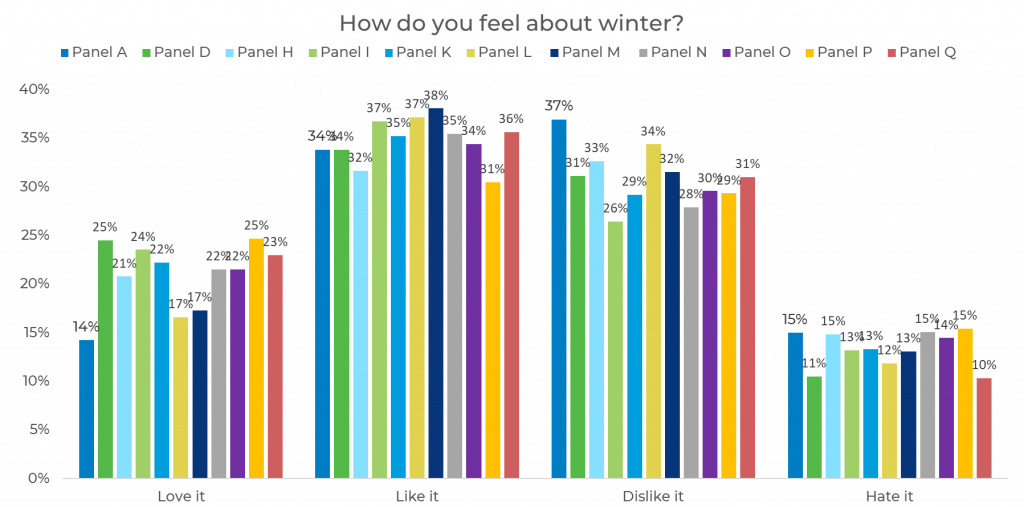
When looking at public perception of winter by panel, we can see that there are a lot of variances. The greatest differences can be seen among respondents who love winter and dislike winter where there are up to 11% differences between panels. Among those who like winter there is up to a 7% difference. There is the least amount of difference among those who hate winter with only up to a 4% difference between panels.
To learn more about public perceptions on ‘hot’ topics, why panels are different from one another, and why they change over time, download The Sample Landscape: 2022 Edition today!

