
Intellicast S4E23 – A SampleCon 2021 Preview with Mary Draper
July 9, 2021
The Factors Behind Respondent Experience and Why They Matter
July 19, 2021
Throughout our research-on-research, we have established that the device used by a respondent actually impacts how they rate brands and concepts. The same is true for the age of a respondent. In this blog, we look at how device and age are linked and how they impact brand ratings, awareness, and purchase intent.
Responses Vary by Device
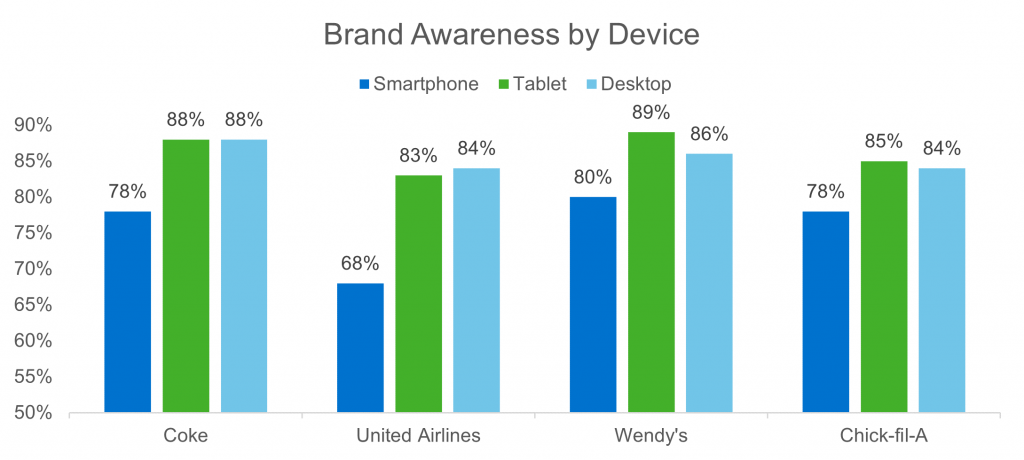
When respondents in our latest round of research were asked which brands they were aware of, those using smartphones tended to have the lowest awareness across all brands.
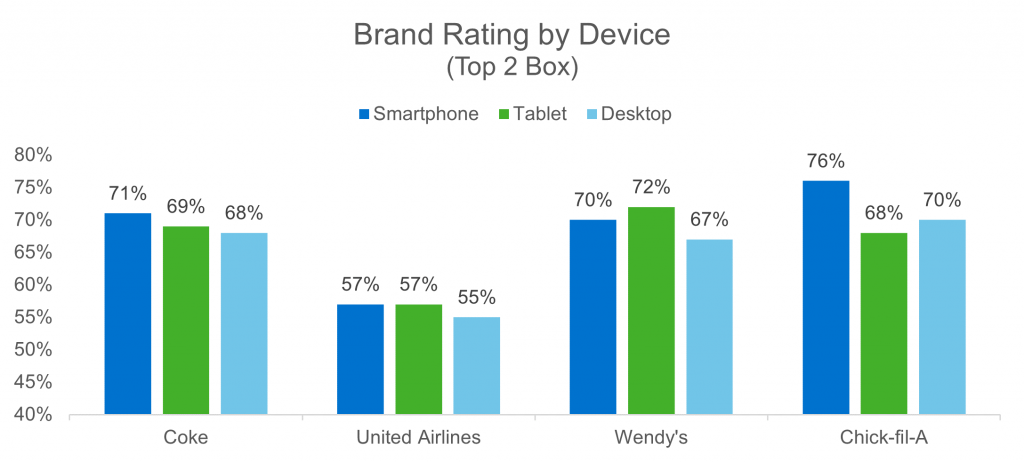
These differences carry true when we look at how respondents rate brands as well. Respondents were asked to rate the brands they are aware of on a 5-point scale, and the top 2 box for each brand by device are shown below. We see that smartphone users tend to rate brands higher overall than users of other devices, followed by tablet users.
These differences in awareness and ratings likely have something to do with the fact that using a different device will provide a different survey experience, which in turn will affect the way respondents answer questions. However, another important factor to look at alongside device usage is the age of respondents.
Device Usage by Age Group
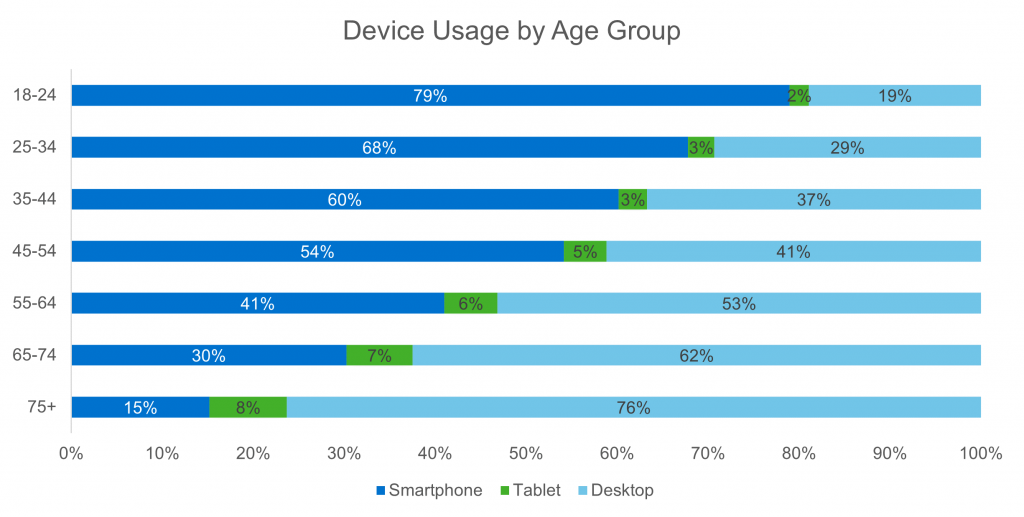
When device usage is broken down by age group, it is clear that younger respondents are more likely to be taking a survey on a mobile device, whereas older respondents are more likely to use a desktop. 79% of respondents aged 18-24 use a smartphone to take surveys while 76% of those 75 and older use a desktop, and we can see that device usage shifts incrementally with each age group in between.
Differences Exist by Device Regardless of Age
A common suspicion would be that the differences in responses that we observe by device are due to the age of the respondents using each device. However, even when we isolate responses by age group, there are still significant differences by device.
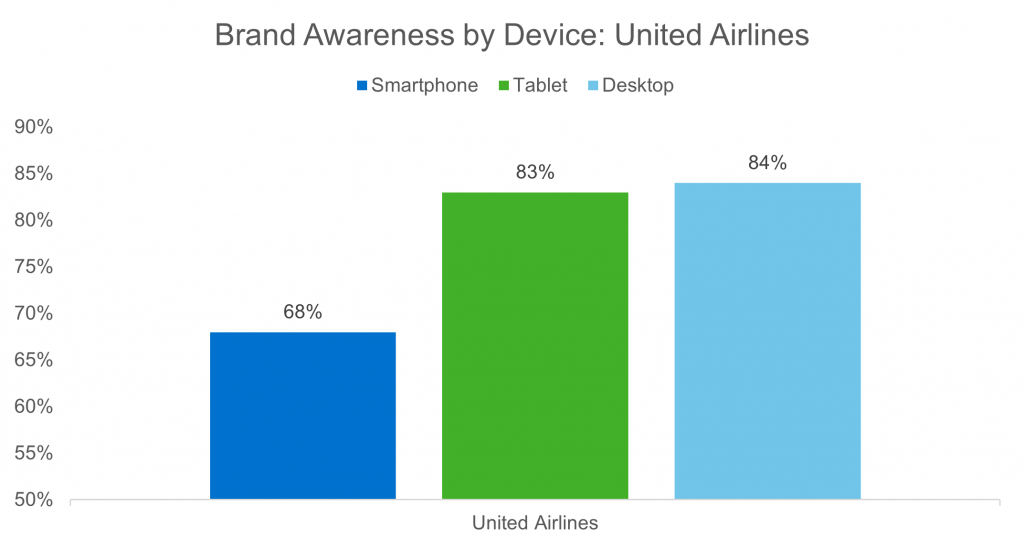
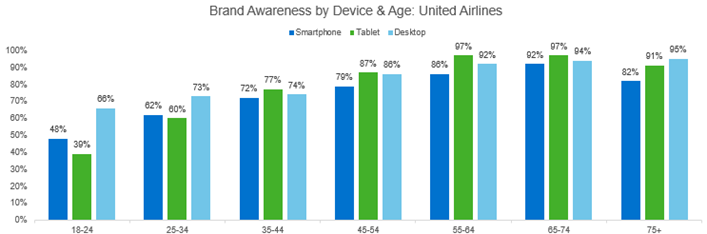
We saw earlier that, overall, smartphone users tend to have the lowest brand awareness. Take United Airlines for example. 68% of smartphone users were aware of the brand, while 83% of tablet users and 84% of desktop users were.
When broken down by age, we see that younger groups tend to have a lower brand awareness than older respondents. However, the trend across device is fairly constant; smartphone users tend to have lower awareness for all groups except the youngest respondents from 18-34.
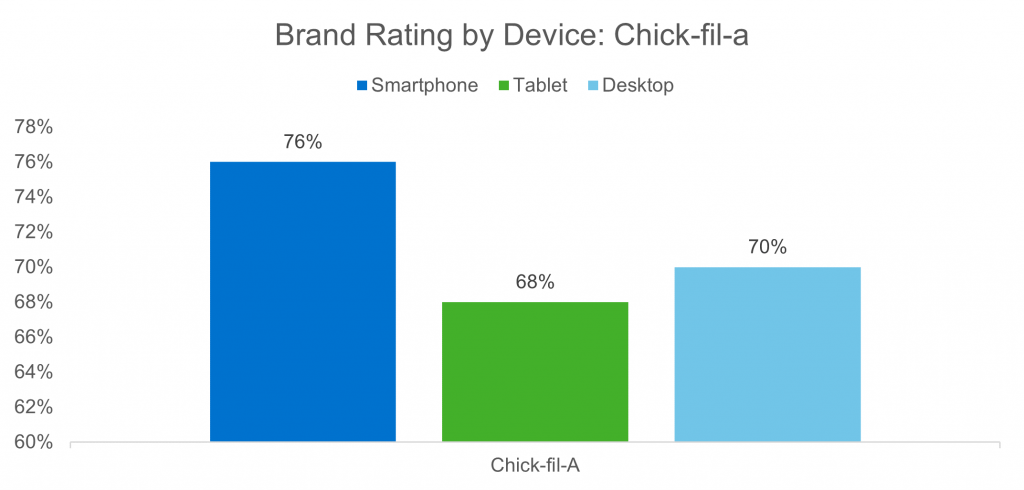
There are also noticeable trends for brand rating. Recall that we saw that tablet users rated Chick-fil-A the lowest on average, while smartphone users rated the brand the highest.
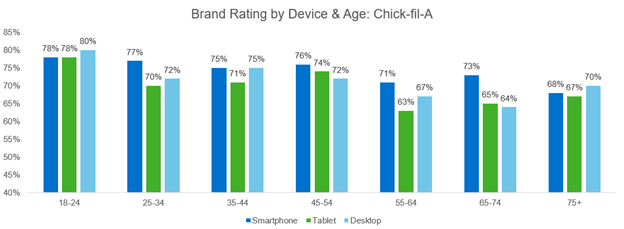
When segmented by age, we see that brand rating still varies by device. For most age groups, tablet users rate Chick-fil-A lower than respondents using other devices, and smartphone users rate the brand higher.
Purchase Intent: Smartphone vs. Desktop
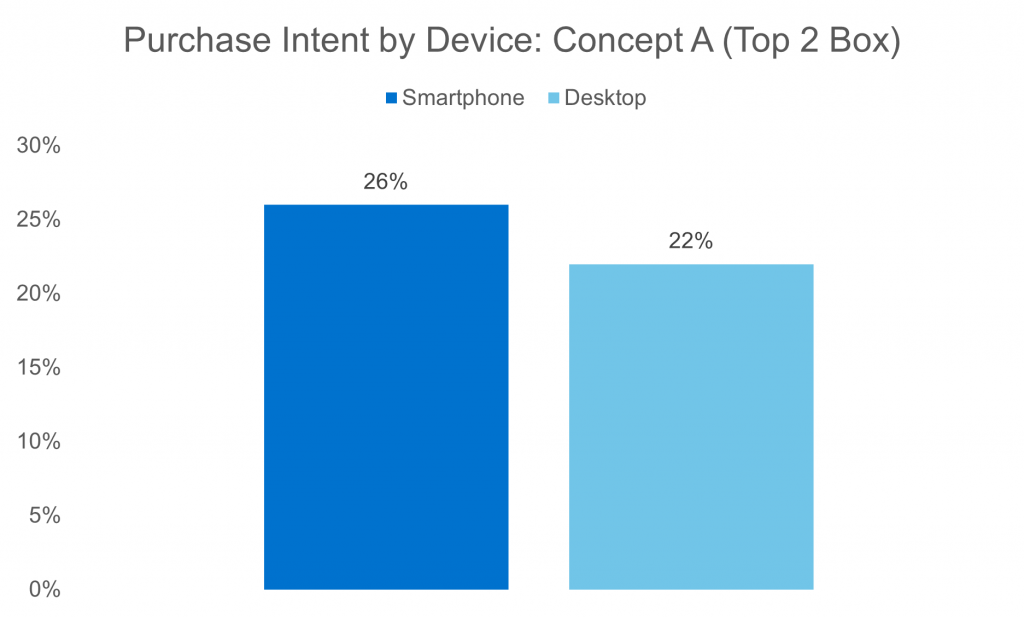
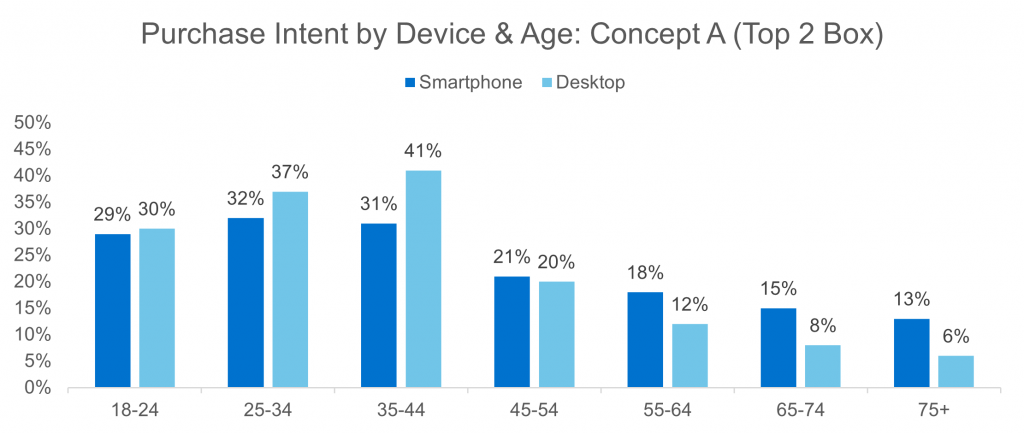
Respondents were also asked about their purchase intent for several different concepts and their responses were measured on a 10-point scale. For each concept, we saw consistent differences in purchase intent depending on the device respondents used. An example is seen in Concept A, where we saw that smartphone users were 4% more likely to purchase the concept product than those using a desktop.

Things become even more interesting when we look at purchase intent by device and age group together. We found that, for a given concept, respondents in younger age groups tended to rate their purchase intent higher when using a desktop than a smartphone, whereas the opposite is true for older respondents. It appears that there is a turning point between the 35-44 and 45-55 age groups in which respondents start to rate purchase intent higher on a smartphone rather than a desktop. The results for Concept A are shown below.
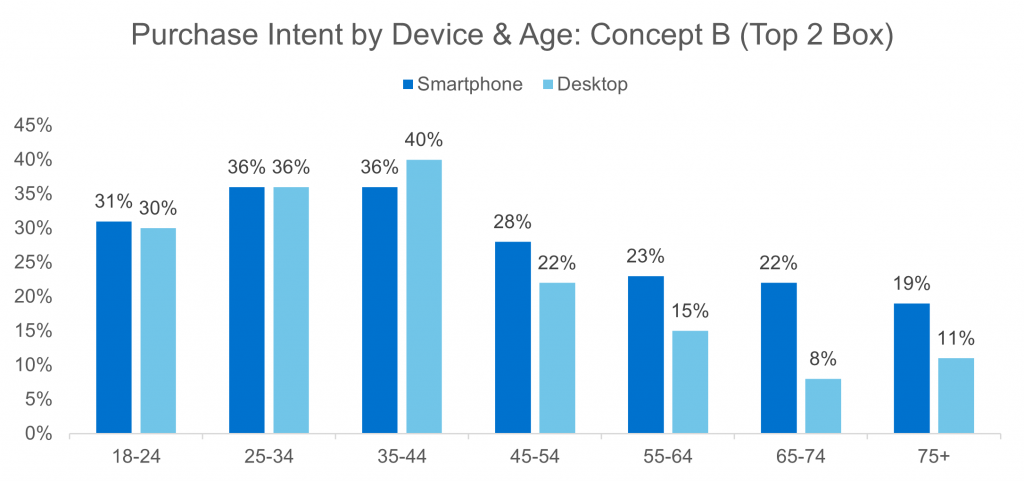
Similar results can be seen across several different concepts. The purchase intent by device and age group for Concept B are below.
Device usage has clear impacts on responses including KPI’s such as brand rating, awareness, and purchase intent. It is important to note that device usage is often linked to age with younger respondents more likely to use a mobile device for surveys. However, regardless of age, the differences among devices remain constant. That’s why it’s crucial to design your survey to be device agnostic in order to get a combined dataset that will most accurately reflect the feelings of respondents.
Although differences in attitudes and behaviors are often tied to differences in age, when looking at changes in brand perceptions, age and device usage do not correlate. This is why it’s important to blend sample to ensure that you have a representative group of respondents for your data.
To learn more about survey design and device usage check out these additional blogs and resources:
Getting the Best Results: Best Practices in Survey Design
Visual Presentation and its Impact on Respondent Experience and Data
Designing Surveys: 13 Tips to Avoid Common Mistakes – Part 1

