
Respondents Are People Too: A Conversation with Lorin Drake of Publix
July 1, 2025Rebrands, Acquisitions, and a New Report on Synthetic Data
July 15, 2025
Rising temperatures and packed swimming pools can only mean one thing: summer is in full swing. From casual cookouts to scenic hikes, warm-weather activities help us embrace the outdoors for a few months of the year. There is a wide range of possibilities for the upcoming months, and our research-on-research offers insight into how different groups are enjoying the heat. For each demographic, we examined the most polarizing responses to better understand the differences in participation and preference.
Overall
Overall, visiting family or friends tops the list of planned summer activities, with 63% of respondents planning to reconnect in person. Attending a barbecue or cookout follows at 49%, closely trailed by going to an ice cream shop at 45% and visiting the beach or lake at 44%. A sizable group (41%) plans to travel for vacation or a weekend getaway. On the lower end, just 2% selected “Other,” while 10% say they don’t expect to participate in any listed activities.

Gender
Breaking down the data by gender shows a few notable variations. Women are slightly more likely to attend a cookout (51% vs. 47%) and visit family or friends (65% vs. 61%). Men are more inclined toward camping or hiking (29% compared to 26%) and significantly more likely to attend a sporting event, at 31% versus 15%. Men also edge out women in amusement park visits (26% vs. 22%), reflecting a preference for more active or entertainment-centered outings.

Age
Age reveals some of the most striking divides in summer activity preferences. One of the clearest patterns is the steep generational drop in amusement park interest. Participation peaks at 32% among 18-24-year-olds but falls steadily after age 44, reaching only 8% among those 65 and older. Pool or water park visits follow a similar decline, with 41% to 44% of adults under 45 showing interest, compared to just 20% among seniors.
Conversely, visiting family or friends becomes more common with age. While 57% of 18-24-year-olds plan to reconnect in person, that number rises steadily to 78% for those 65 and older—the highest participation rate in any category for that age group. Cookouts also trend upward by age, starting at 37% for the youngest respondents and increasing to 54% for seniors. Camping and hiking show a middle-age peak, reaching 34% among those 35-44, then tapering off to 14% for the 65+ group. These trends reflect how summer priorities shift over time, from thrill-seeking and water fun to family time and quieter outdoor experiences.

Income
Income is a strong influence on planned summer activities, with the number of respondents who plan to do each activity declining as income level declines. Those making under $20,000 participate less across nearly every activity, including just 20% planning vacation travel. That figure climbs steadily with income, reaching 58% among those earning $100,000 or more. Visiting family or friends follows a similar trajectory, increasing from 48% at the lowest income tier to a peak of 71% among those earning $60,000 to $99,999.
Recreational choices also shift with income. Attendance at sporting events rises sharply, from just 10% among those under $20,000 to 36% among top earners. Cookouts show a gradual rise across brackets, peaking at 58% for the $60,000–$99,999 group. Beach or lake trips become more common with higher income as well, growing from 29% in the lowest bracket to 54% in the highest. These trends illustrate how financial flexibility opens up more seasonal options for higher-income households.

Region
A regional data breakdown highlights several contrasts in planned summer activity preferences. The Midwest leads in attending cookouts (53%), narrowly ahead of the Northeast (51%). For ice cream shop visits, the Northeast takes the top spot at 54%, followed by the Midwest at 48%. The West is most likely to go camping or hiking, with 35% participation, while the South lags at 23%. Amusement park attendance is highest in the Northeast (29%), slightly ahead of the West (24%) and Midwest (23%). When it comes to beach or lake visits, the Northeast (48%) and West (46%) report the strongest interest, while the Midwest again shows the least engagement at 40%.

Ethnicity
Ethnicity-based differences are evident in several categories. Caucasian respondents lead in cookouts (51%) and visiting family or friends (66%), while Hispanic/Latino respondents are the most likely to go to a water park or pool (45%). Asian respondents show higher travel intent (49%) and a solid showing in visiting family or friends (64%). African-American respondents are least likely to go camping (18%) and report slightly lower overall participation across most activities.

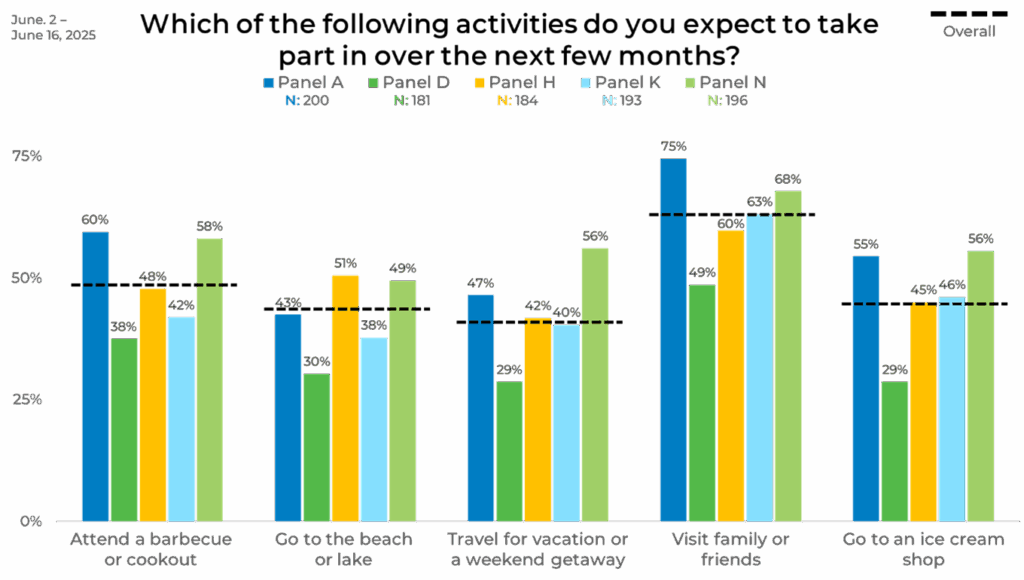
Panel
Looking at the data by panel reveals how different methodologies can significantly shape outcomes. For example, 75% of respondents in Panel A plan to visit family or friends, compared to just 49% in Panel D, a gap of 26 percentage points. Similarly, cookout attendance ranges from 60% in Panel A to just 38% in Panel D. Beach or lake trips vary from 51% in Panel H to only 30% in Panel D. Even ice cream shop visits differ widely, with Panel A at 55% and Panel D at 29%. These variations highlight how relying on a single panel can produce an incomplete or skewed view. Panel A consistently reports the highest participation across multiple activities, while Panel D consistently reports the lowest.
By not combining these perspectives, interpretations of the data could be significantly biased. When only relying on one panel, data collection and results suffer by not adequately incorporating all realities into decision-making. EMI’s Strategic Sample Blending brings together panels to help ensure a more accurate and representative understanding of public behavior, instilling high confidence in your data-driven decisions.


