The “No Sh*t, Sherlock” Episode
November 25, 2025
America’s Money Mood for 2026: Cautious Optimism…Emphasis on Cautious.
December 9, 2025Better Off, Worse Off, or Just Treading Water? Inside How Americans Feel About Their Finances

While it may not seem like it, the performance of the economy is a very personal concept. Everyone forms their opinion on its performance from their own lives and experiences. When you ask people about the economy, what you are really asking is if their financial situation is good or bad.
The economy, especially people’s individual financial situation, took center stage int eh 2024 election, and continues to be a main focus through 2025. Prices on many goods and services continue to rise and people are starting to feel it weigh on them.
We wanted to gauge how people felt about their current financial situation and if they felt they were in a better state than they were a year ago. Let’s dive into what we found in our latest wave of research-on-research.
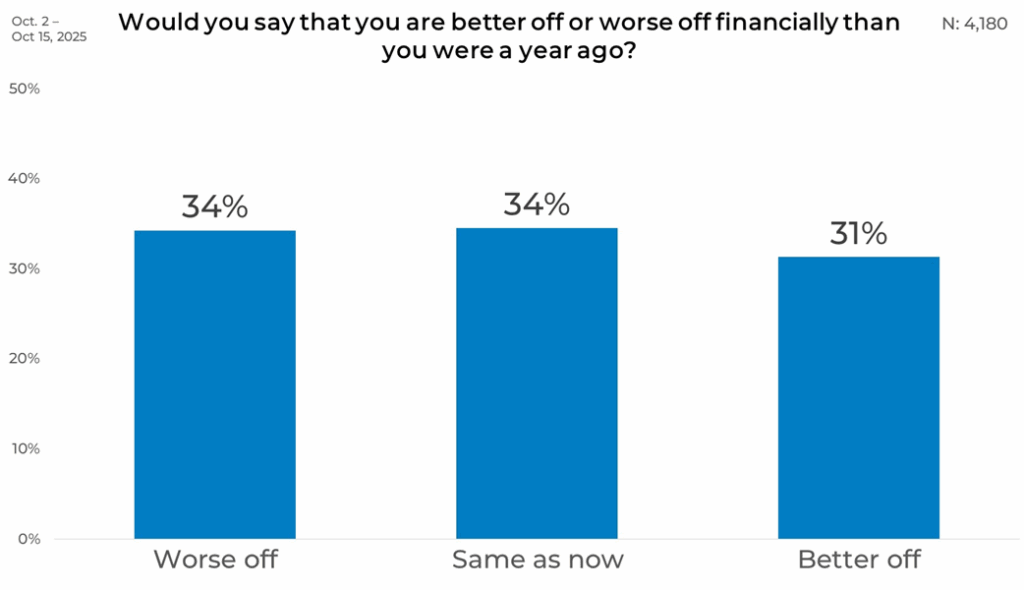
Overall
Looking at the total results, 34% say they are worse off, 34% feel the same, and 31% say they are better off. The closeness of these numbers shows a mixed landscape, with no single viewpoint dominating the overall outlook, highlighting the personal nature this topic takes with everyone.
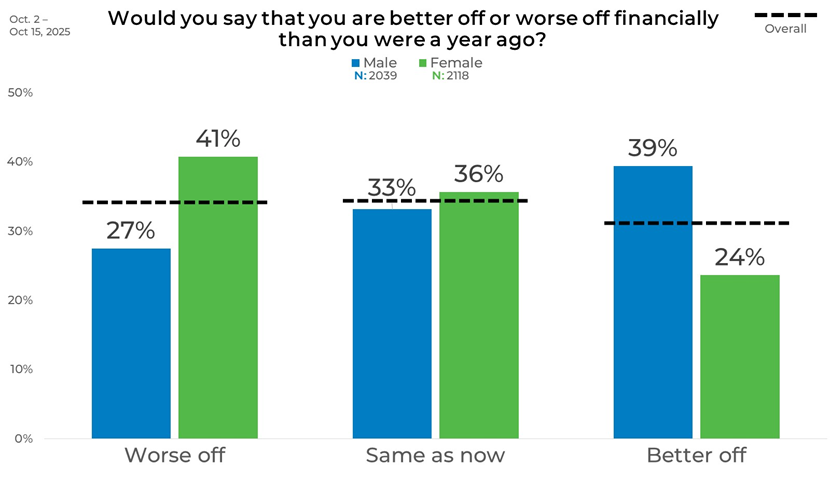
Gender
Among men and women, the differences are notable. Men report being worse off at 27%, while women reach 41%. At the same time, 39% of men say they are better off compared to 24% of women, ending in a divide that stands out clearly in the data.
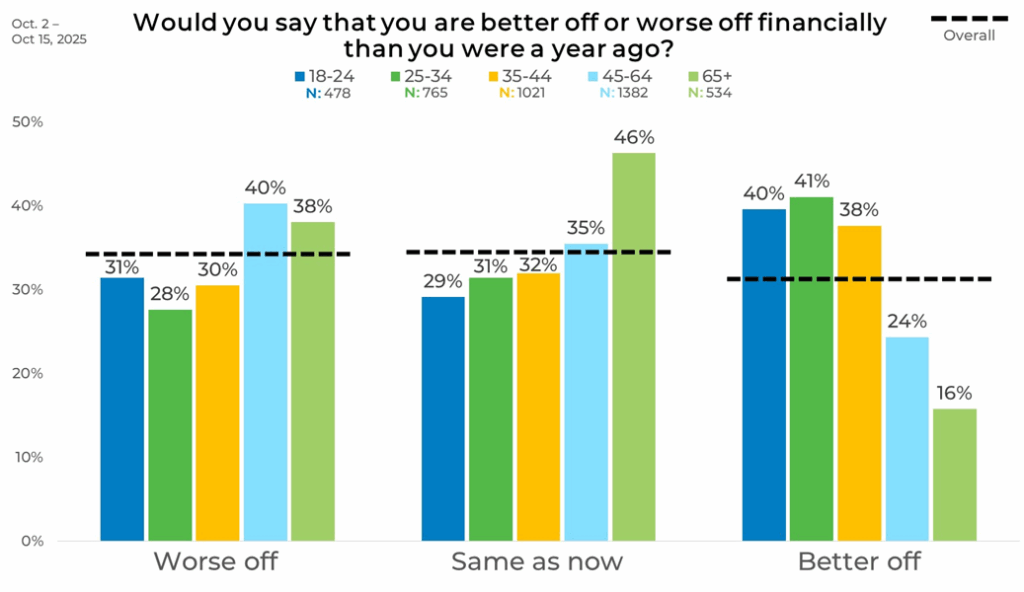
Age
Age seems to have a significant impact on people’s view on their financial state. Adults 18–24 report being better off at 40%, and those 25–34 follow closely at 41%. As age increases, the share reporting that they are better off drops steadily, reaching 16% among those 65 and older.
Older adults, especially those 45 and above, are more likely to say they are worse off or about the same, with 40% of adults 45–64 feeling worse off and 46% of adults 65+ reporting no change. The overall pattern shows stability rising with age, ending in a consistent view among older respondents.
Income
Some of the most significant differences were uncovered when we broke down the data by income level. Lower-income groups, particularly those under $20,000 and those earning $20,000–$39,999, report the highest rates of feeling worse off at 44% in both cases. The contrast between these groups and higher-income households is wide, closing with a noticeable income divide.
Higher-income households show a very different financial outlook. Those earning $100,000 or more report the highest number of respondents saying they are better off at 51%, while the portion saying they are worse off drops to 17%.

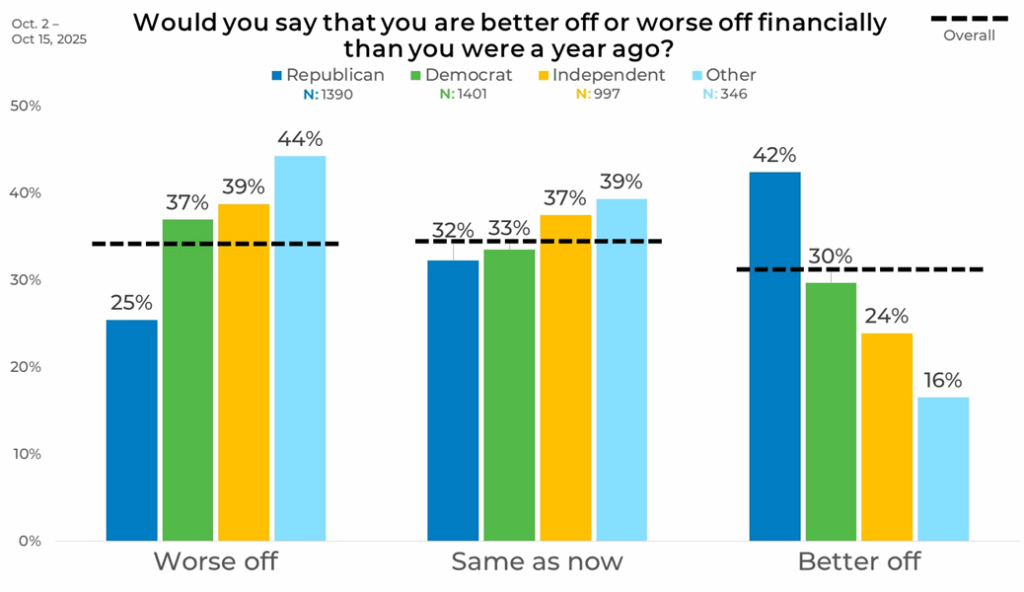
Political Affiliation
Political affiliation uncovered some distinct patterns. Republicans report being better off at 42%, while Democrats and Independents report higher levels of being worse off at 37% and 39%.
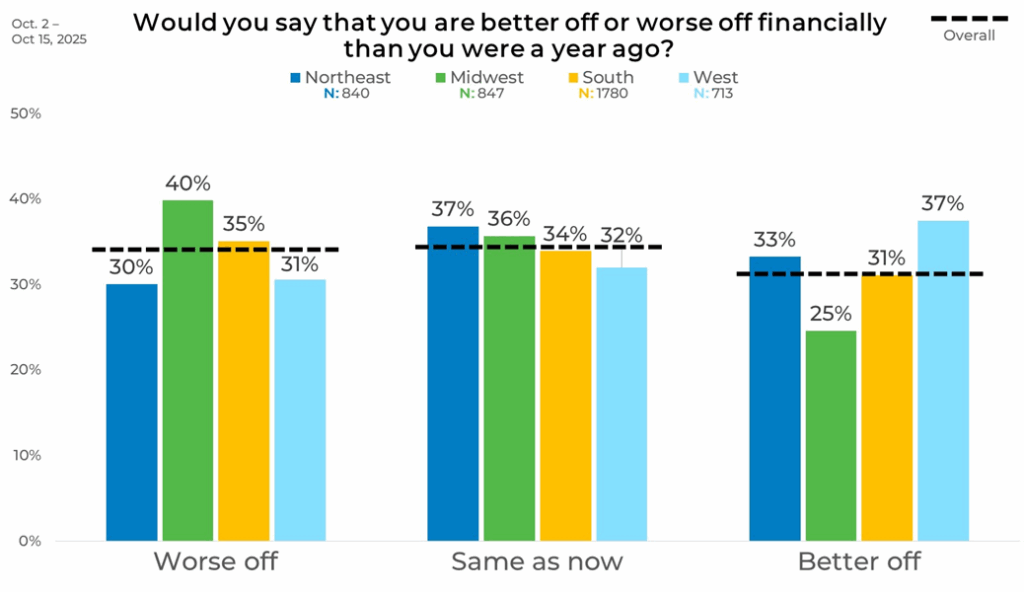
Region
Across regions, people’s financial perspectives varied. The Midwest has the largest share saying they are worse off at 40%, while the West shows the highest portion saying they are better off at 37%. The Northeast and South fall between these two points, adding more variation to the regional landscape.
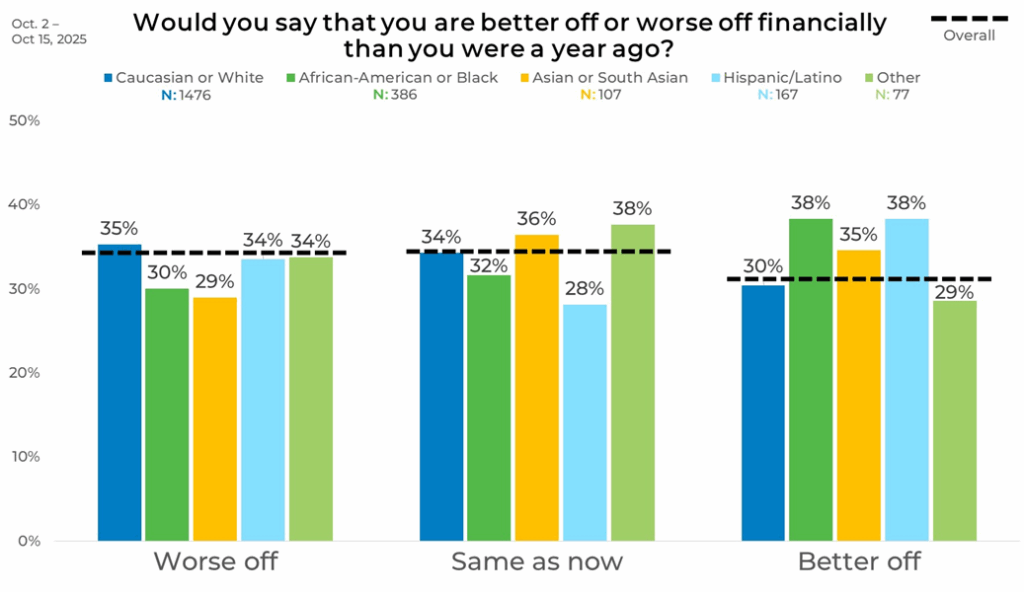
Ethnicity
Caucasian respondents report being worse off at 35%, while African American and Hispanic/Latino respondents show higher shares saying they are better off at 38% each. Asian and South Asian respondents have 35% saying they are better off, ending with a balanced pattern across these groups.
At the same time, feelings of being worse off remain relatively close across most ethnicities. Shares range from 29% among Asian and South Asian respondents to 35% among Caucasian respondents, while African American respondents report a slightly lower rate at 30%.
Panel
The panel data shows how responses can shift depending on the source. Panels B, D, G, and M show worse-off levels between 35% and 40%, while Panel U stands apart with only 18% saying they are worse off and 53% saying they are better off.
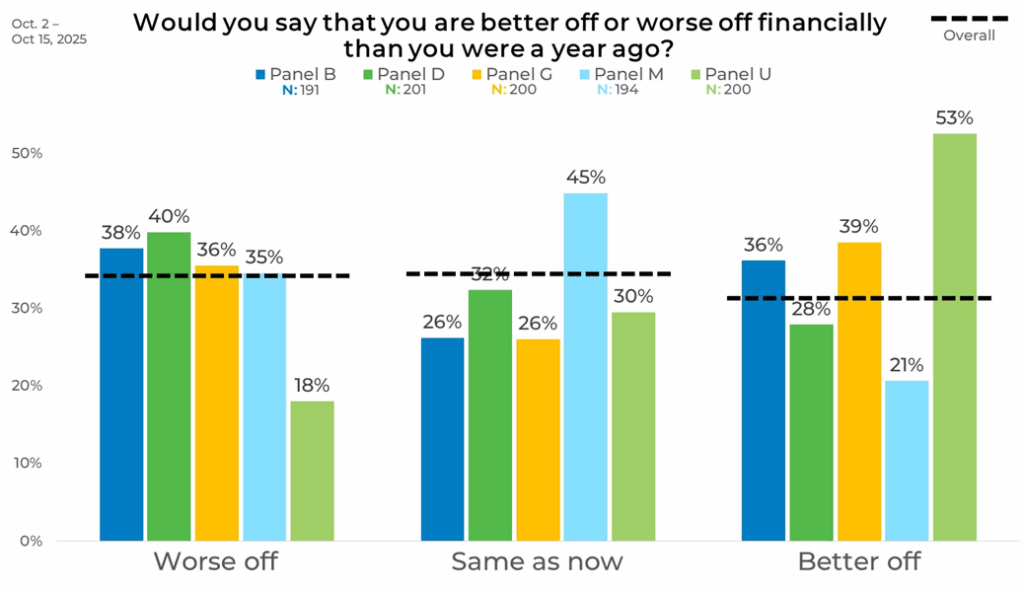
These findings highlight the need to blend sample sources to ensure you mitigate bias and get an accurate picture from consumers. Find out more about Strategic Sample Blending by clicking the button below.

