
Better Off, Worse Off, or Just Treading Water? Inside How Americans Feel About Their Finances
December 1, 2025
Is the Nation on the Right Track? Depends on How Generous You’re Feeling
December 9, 2025
When asking people about their financial situation, focusing only on the current state doesn’t give you the whole picture. To do that, you need to ask about how people view the future.
In part two of our series, we dug into how people view the state of the economy and what they expect their financial situation to be a year from now.
Let’s dive into what we found.
Overall
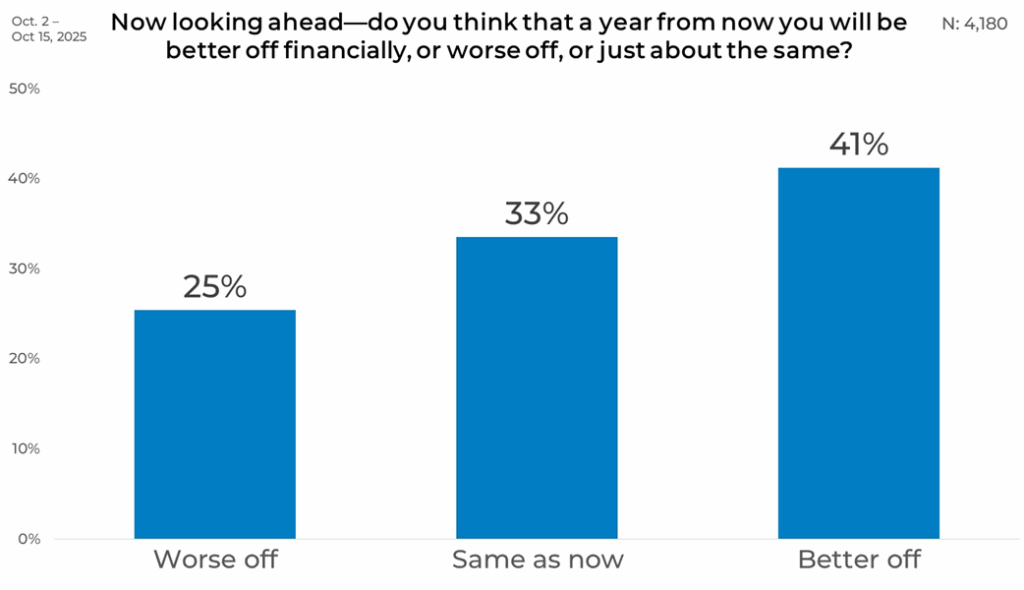
Across all respondents, 41% believe they will be better off financially a year from now. Another 33% expect things to stay the same, while 25% think they may be worse off. These numbers establish a clear starting point, showing optimism as the leading outlook overall.
Gender
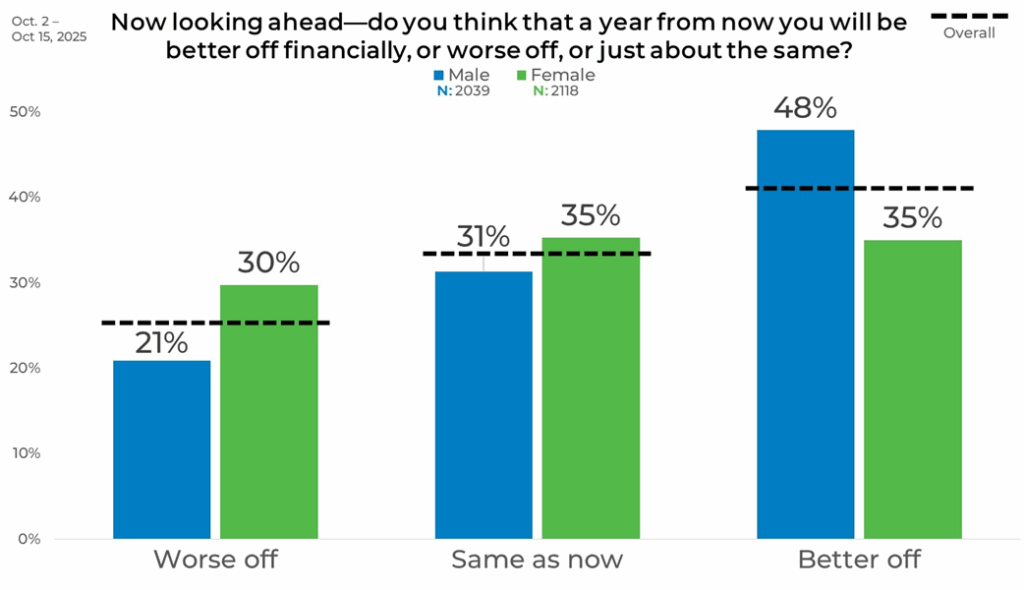
When comparing results by gender, men show more confidence about the year ahead. Among men, 48% expect to be better off, 31% expect stability, and 21% believe they might be worse off. Women are more cautious: 35% expect to be better off, 35% expect their situation to stay the same, and 30% think they may be worse off.
Age
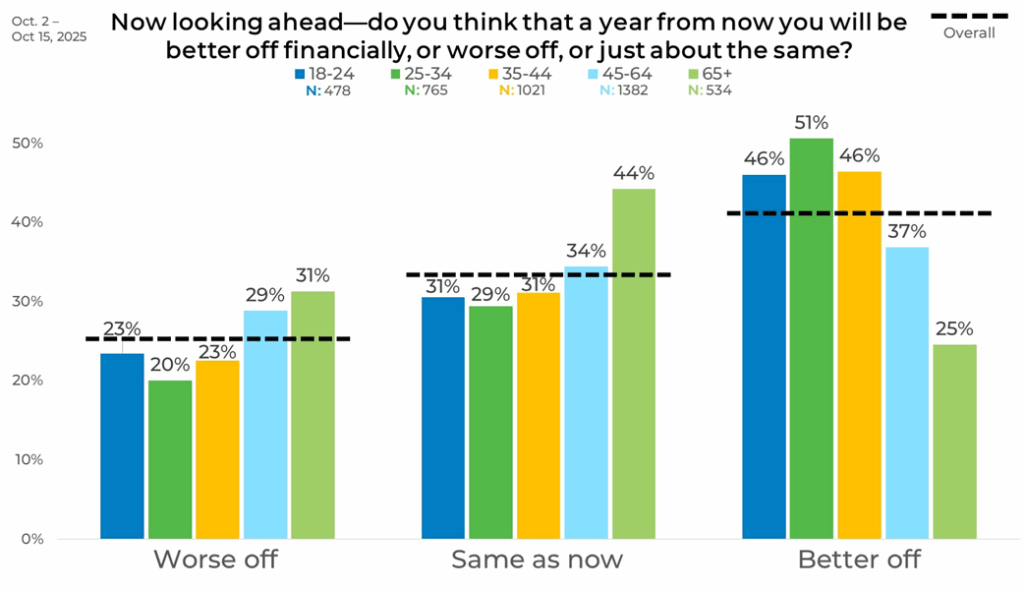
Age plays a strong role in shaping financial expectations. Younger adults are the most optimistic: 46% of those 18–24 and 51% of those 25–34 expect to be better off. The share drops to 46% among 35–44-year-olds, then falls more sharply to 37% among those 45–64 and 25% among those 65 and older.
Across the same age brackets, the share expecting to be worse off rises with age. While 23% of those 18–24 foresee being worse off, the number grows to 31% among those 65 and older. Expectations of staying the same also grow with age, reaching a high of 44% among the oldest group. These totals reinforce how financial outlooks evolve across life stages.
Income
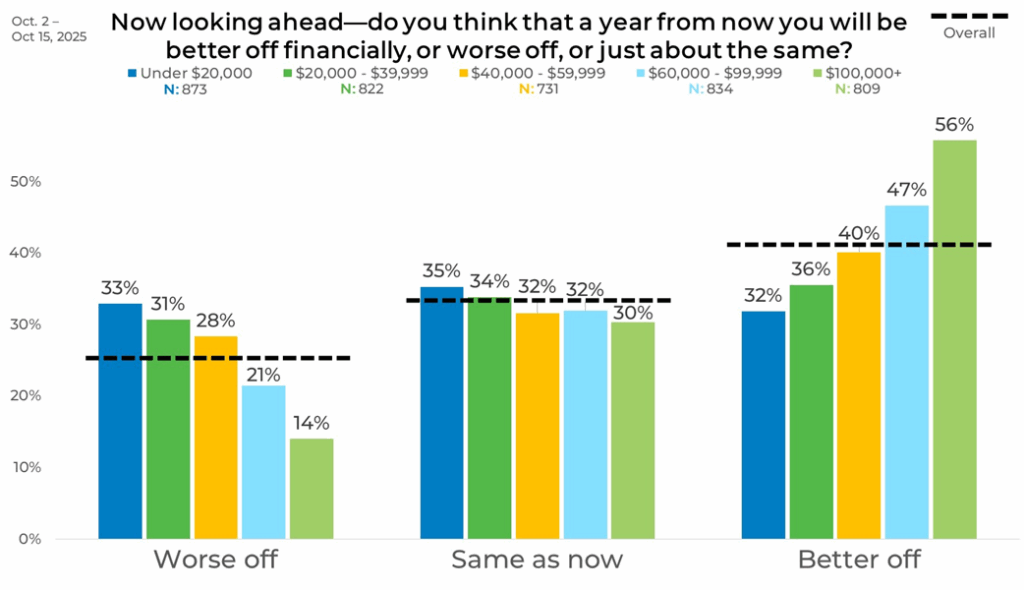
Among those earning under $20,000, 32% expect to be better off and 33% expect to be worse off. Optimism rises steadily with each income group: 36% among those earning $20,000–$39,999, 40% among those earning $40,000–$59,999, 47% among those earning $60,000–$99,999, and 56% among those earning $100,000 or more.
Expectations of being worse off decreased sharply with rising income, from 33% among the lowest earners to 14% among the highest. Expectations of staying the same remain steadier, ranging from 30% to 35% across all income levels.
Political Affiliation
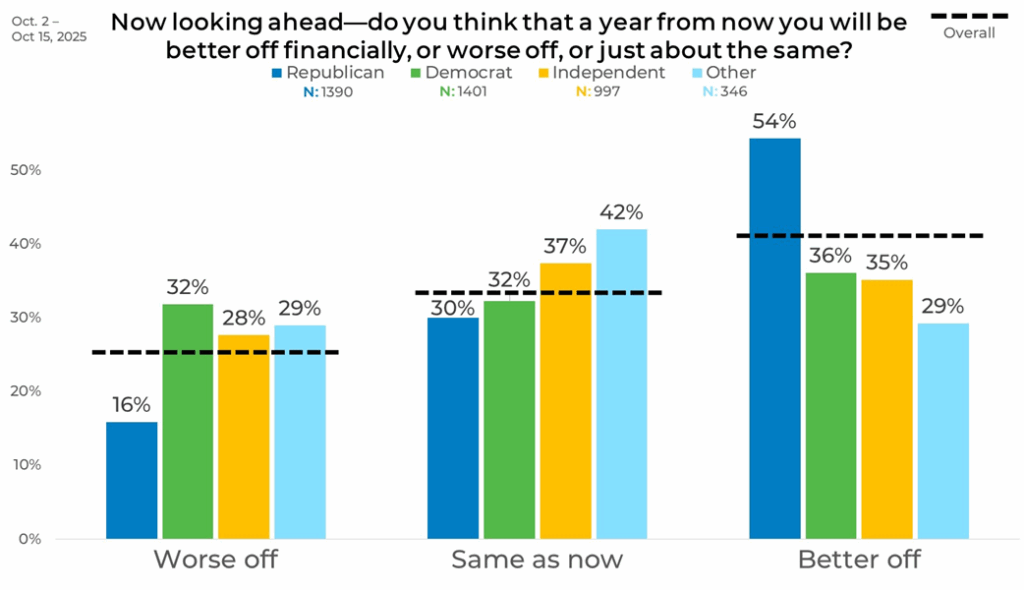
Unsurprisingly, political affiliation also plays a role in shaping people’s economic outlook. Republicans show the highest optimism, with 54% expecting to be better off, compared with 36% of Democrats, 35% of Independents, and 29% of those identifying as “Other.” At the same time, 32% of Democrats and 28% of Independents expect to be worse off than they are now, compared with 16% of Republicans.
Region
Unsurprisingly, political affiliation also plays a role in shaping people’s economic outlook. Republicans show the highest optimism, with 54% expecting to be better off, compared with 36% of Democrats, 35% of Independents, and 29% of those identifying as “Other.” At the same time, 32% of Democrats and 28% of Independents expect to be worse off, compared with 16% of Republicans.
Ethnicity
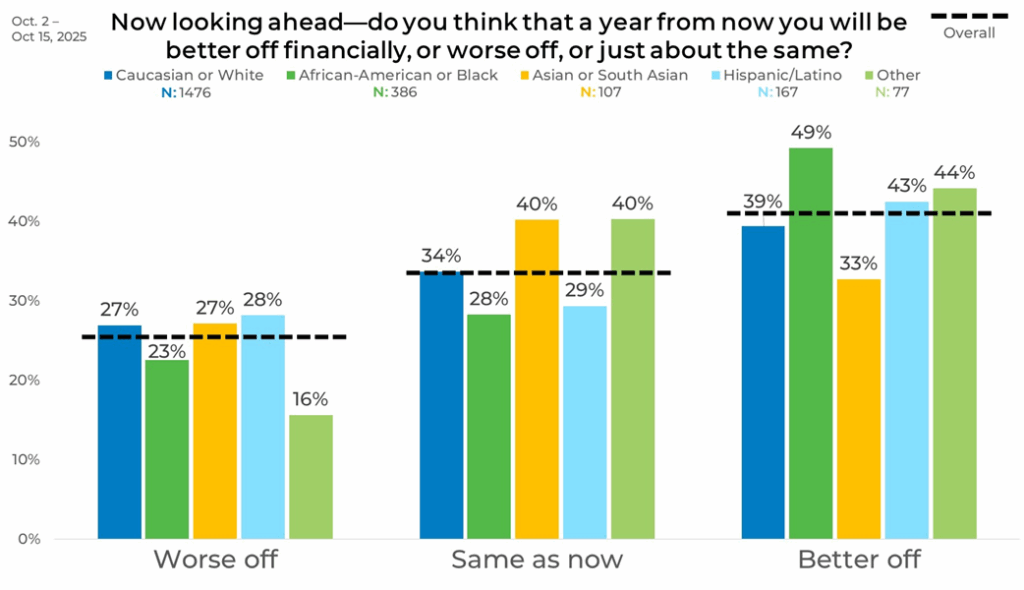
There were some definite trends when the data was broken down by ethnicity. African American respondents show the highest level of optimism, with 49% expecting to be better off. Hispanic/Latino respondents follow at 43%. Caucasian respondents show 39% expecting improvement, while Asian or South Asian respondents come in at 33%.
Expectations of being worse off also differ, with 27% among Caucasian respondents, 23% among African American respondents, and 28% among Hispanic/Latino respondents reporting this.
Panel
Finally, when we looked at the data by panel we found significant differences by source. Panel U shows the strongest optimism, with 59% expecting to be better off. Panel G follows at 46%, while Panels N and C report 41% and 39%, respectively. Panel H reports the lowest optimism at 30%. Looking at those expecting to be worse off, Panel C is highest at 33%, while Panel U is lowest at 11%.
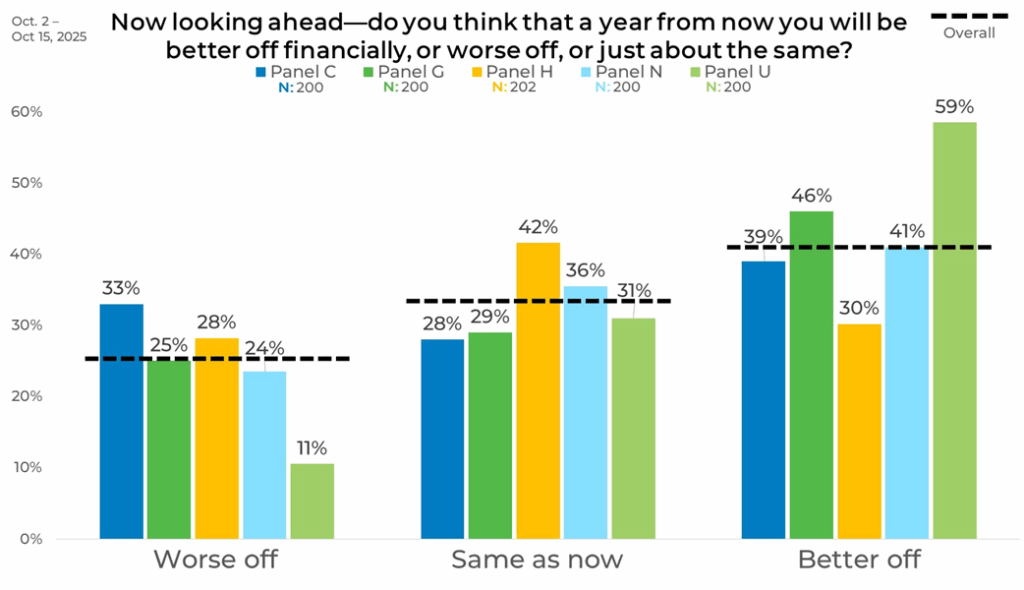
These results highlight why you need to strategically blend your sample when conducting online quantitative research. Strategic blending ensures you reduce any potential bias that comes with sample source selection.


