
More Than Creating Funny Images: What We Are Actually Using Gen AI For
January 6, 2026
New Year, New Hopes: People’s Outlook For 2026
January 13, 2026
We are only a couple of weeks into the new year, which is still a good time to reflect on 2025 as a whole. In our most recent round of research-on-research, we asked respondents to look back on 2025 and rate their overall experience.
Let’s dive into what people thought of 2025.
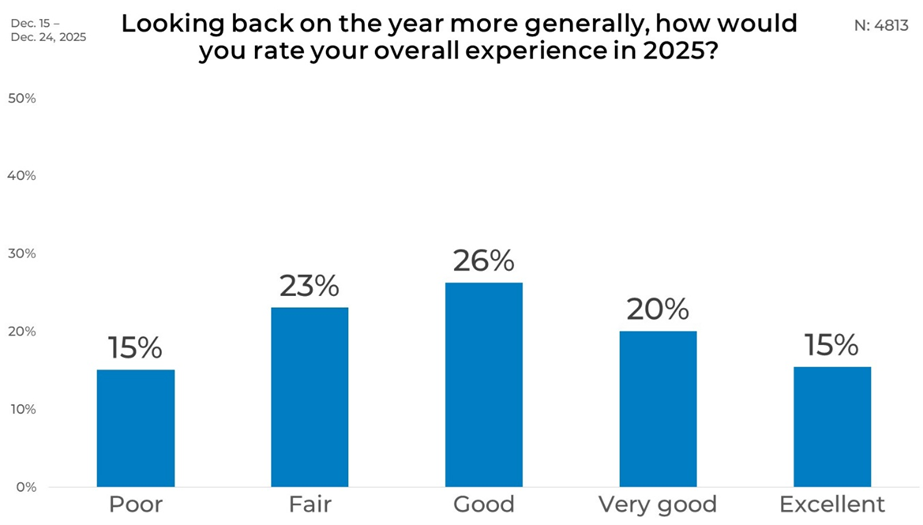
We asked people to rate on using a five-point scale ranging from Poor to Excellent. While the full scale was used for the overall results, the demographic breakouts focus on condensed groupings: the Top 2 Box (T2B), combining Very good and Excellent, and the Bottom 2 Box (B2B), combining Poor and Fair.
Overall
Overall, views of 2025 were mixed. About one-quarter of respondents rated their experience as Good (26%), while 35% placed themselves in the top two categories, with 20% selecting Very good and 15% Excellent. On the more negative side, 38% fell into the bottom two categories, including 23% who said Fair and 15% who said Poor. These results highlight how individual circumstances impact people’s feelings.
Gender
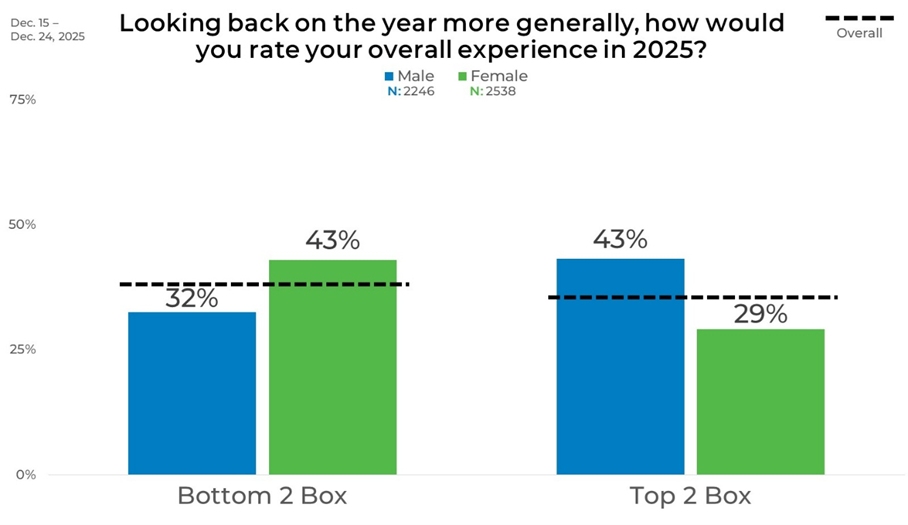
Ratings differed notably by gender when grouped into top and bottom boxes. Men were more likely to report a positive overall experience, with 43% in the Top 2 Box compared with 32% in the Bottom 2 Box. Among women, the pattern reverses: 43% fell into the Bottom 2 Box, while 29% rated their year in the Top 2 Box. This creates a clear contrast in how men and women summarized their experiences of 2025.
Age
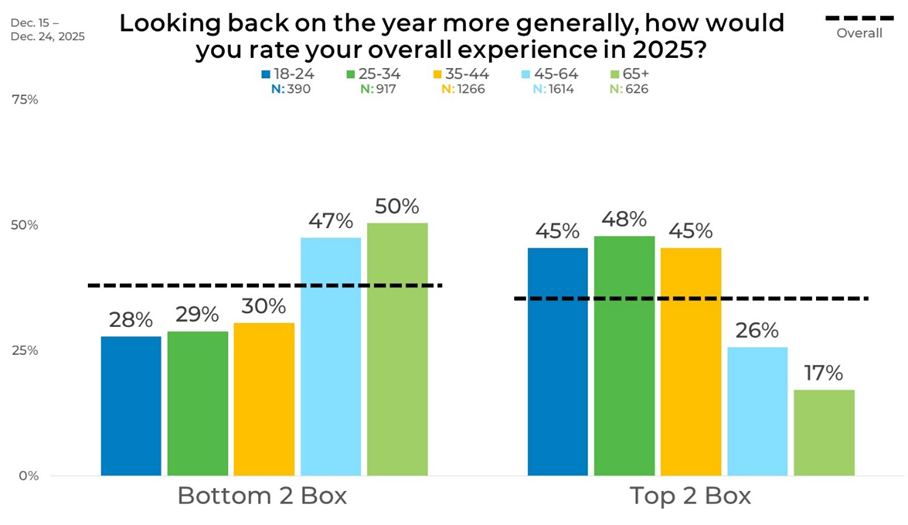
Age was a clear indicator on how people viewed 2025. Younger adults were more positive overall, with 45% of those ages 18–24 and 48% of those 25–34 in the Top 2 Box. Among those ages 35–44, 45% rated their year positively, while 30% fell into the Bottom 2 Box. This pattern reverses among older respondents: 47% of those ages 45–64 and 50% of those 65+ were in the Bottom 2 Box, compared with just 26% and 17%, respectively, in the Top 2 Box.
Income
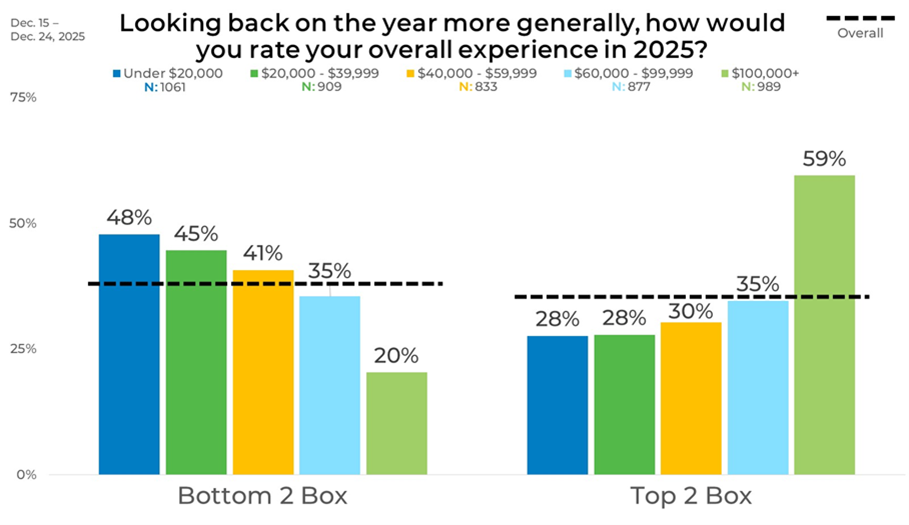
Income level had a direct impact on how people viewed 2025. Respondents earning under $20,000 were more likely to report negative experiences, with 48% in the Bottom 2 Box and 28% in the Top 2 Box. This pattern gradually shifts as income rises. Among those earning $60,000–$99,999, Top and Bottom 2 Box ratings were equal at 35%. At the highest income level, $100,000 or more, a strong majority (59%) rated their experience in the Top 2 Box, while just 20% fell into the Bottom 2 Box.
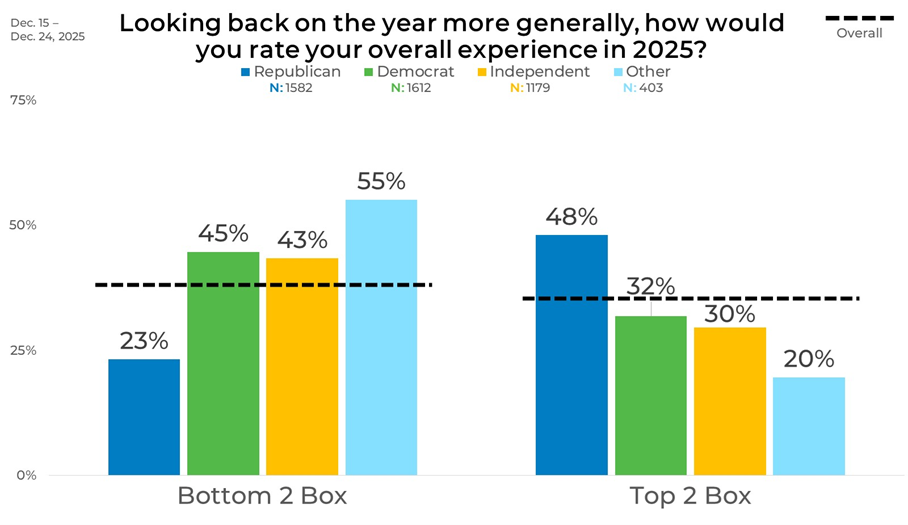
Political Affiliation
Unsurprisingly, political affiliation showed wide variation in overall ratings. Republicans were more likely to place their experience in the Top 2 Box (48%) than the Bottom 2 Box (23%). Democrats showed the opposite pattern, with 45% in the Bottom 2 Box and 32% in the Top 2 Box. Independents were similarly more negative than positive, with 43% in B2B and 30% in T2B.
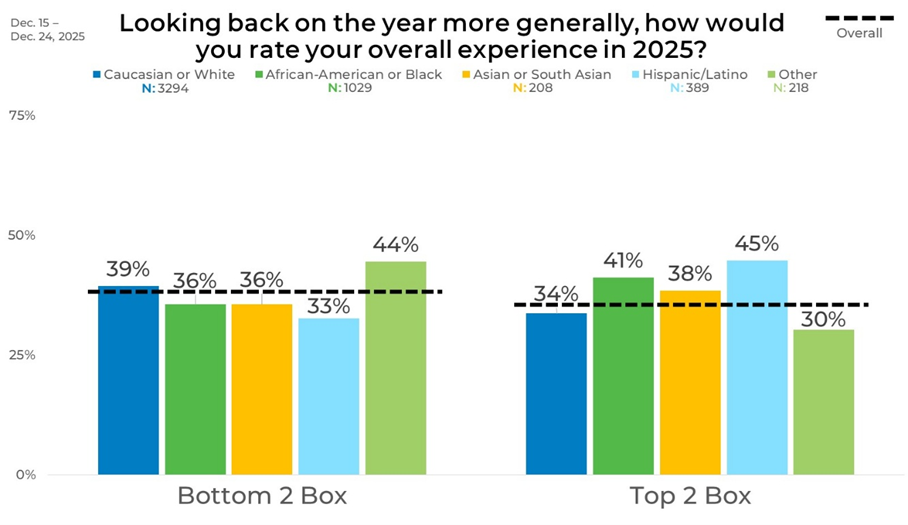
Ethnicity
Responses also vary across racial and ethnic groups. Caucasian or White respondents had slightly more negative than positive ratings, with 39% in B2B and 34% in T2B. African American or Black respondents leaned more positive, with 41% in the Top 2 Box compared with 36% in the Bottom 2 Box. Asian or South Asian respondents showed a similar balance, with 38% in T2B and 36% in B2B. Hispanic or Latino respondents were more positive overall, with 45% in the Top 2 Box and 33% in the Bottom 2 Box.
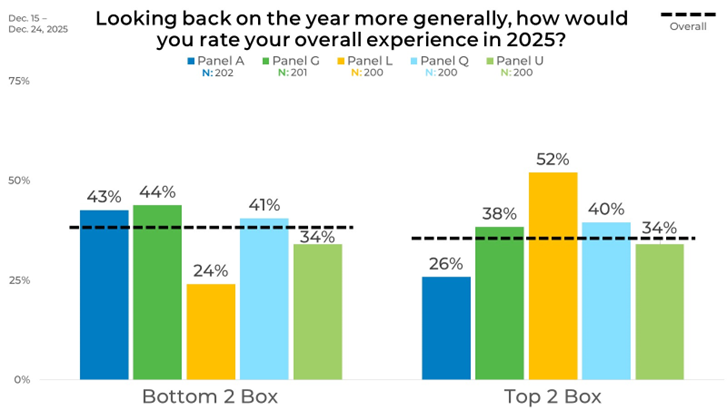
Panel
Across panels, ratings varied significantly from panel to panel, underscoring how individual panels can lean more negative, more positive, or evenly balanced. Panel A and Panel G both leaned more negative, with Bottom 2 Box ratings of 43% and 44%, respectively, compared with Top 2 Box ratings of 26% and 38%. Panel L leaned more positive, with a majority (52%) in the Top 2 Box and 24% in the Bottom 2 Box. Panel Q was closely divided, with 41% in B2B and 40% in T2B, while Panel U showed an even split at 34% for both measures.
These results highlight the need to strategically blend your sample sources. Whether it is demographics or sample source, uneducated blending can lead to biased data and incorrect insights. Learn how EMI can help, click the button below.

