The 2025 Recap
December 30, 2025
2025 In Review: How People Really Rate the Year
January 13, 2026
When asking people if they use Generative AI tools, the natural follow-up is what they are doing with it. In part 3 of our series on AI familiarity and usage, we explore how people are using generative AI.
Let’s dive into what we found: (Click to read Part 1 and Part 2)
Overall
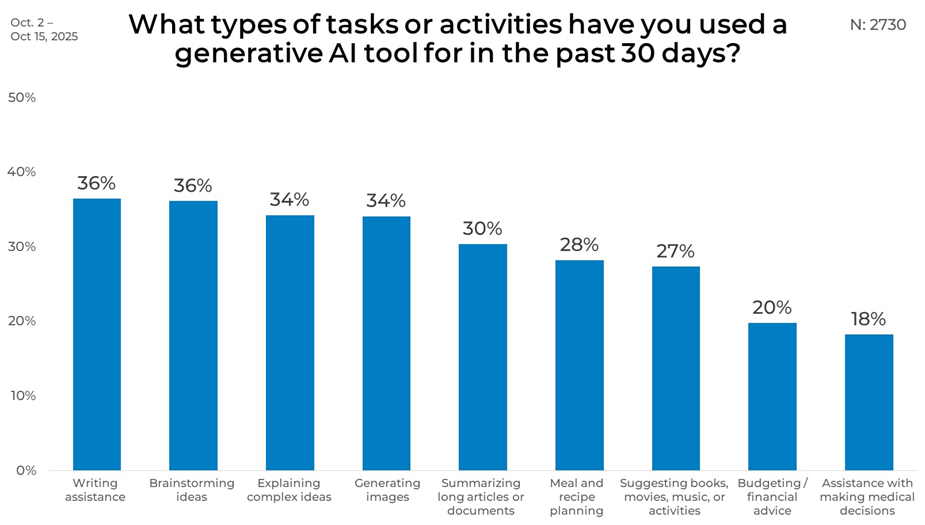
Across all respondents, generative AI use centers on a few core activities. Writing assistance and brainstorming ideas lead at 36% each, followed closely by explaining complex ideas and generating images, both at 34%. These top uses show AI supporting both productivity and creative needs.
Beyond that, usage tapers into more practical tasks. Summarizing long content reaches 30%, meal and recipe planning 28%, and entertainment discovery 27%. More specialized uses, including budgeting and financial advice (20%) and medical decision support (18%), appear less frequently, marking a clear step down from the most common activities.
Gender
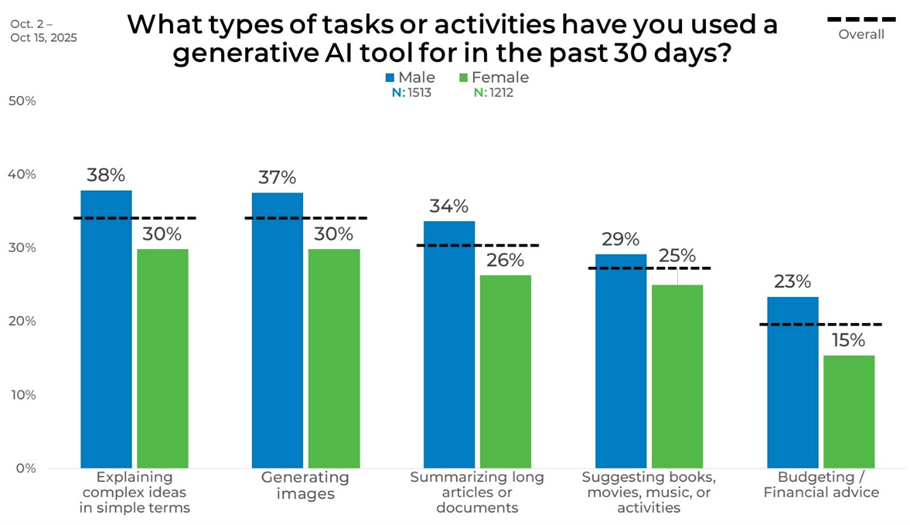
Gender differences are most pronounced in information-intensive and creative tasks. Men report higher usage than women for explaining complex ideas (38% vs. 30%), generating images (37% vs. 30%), and summarizing long documents (34% vs. 26%). These gaps indicate a stronger concentration among men in tasks related to content processing and visual creation.
Women still participate in the same activities, though at lower levels in the areas with the largest differences. Entertainment suggestions show a narrower gap, with 29% of men and 25% of women reporting this use. Budgeting and financial advice also differ by gender, reported by 23% of men compared with 15% of women, highlighting variation in emphasis rather than entirely separate behaviors.
Age
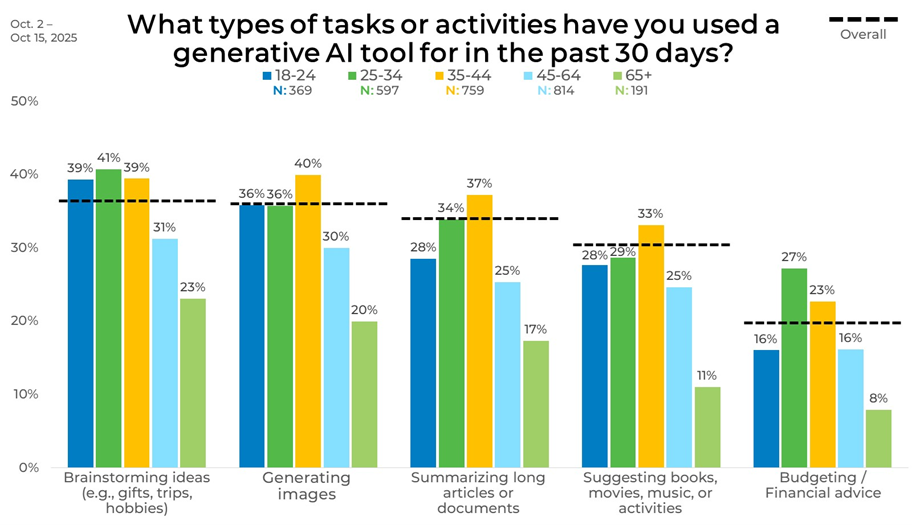
Age clearly plays a role in how generative AI is used. Brainstorming ideas is reported by 39% of adults ages 18–24 and 41% of those ages 25–34, before dropping to 31% among ages 45–64 and 23% among those 65 and older. Generating images follows a similar pattern, peaking at 40% among ages 35–44 and falling to 20% among those 65+.
Summarizing long documents is highest among adults ages 35–44 at 37%, compared with 28% for ages 18–24 and just 17% for those 65 and older. Entertainment suggestions also decline sharply with age, from 33% among ages 35–44 to 11% among the oldest group.
Income
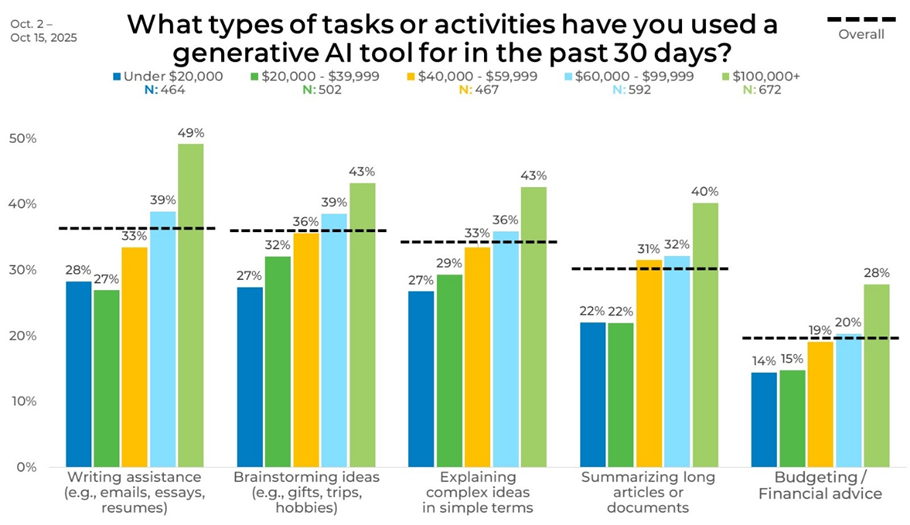
Looking at the data by income identified some differences in generative AI usage. Writing assistance rises from 28% among those earning under $20,000 to 49% among those earning $100,000 or more. Brainstorming ideas follows the same upward pattern, increasing from 27% in the lowest-income group to 43% in the highest-income group.
Explaining complex ideas increases steadily with income, moving from 27% under $20,000 to 43% at $100,000+, while summarizing long documents grows from 22% to 40% across the same range. Budgeting and financial advice also increase with income, with 14% of the lowest earners and 28% of the highest earners reporting this.
Political Affiliation
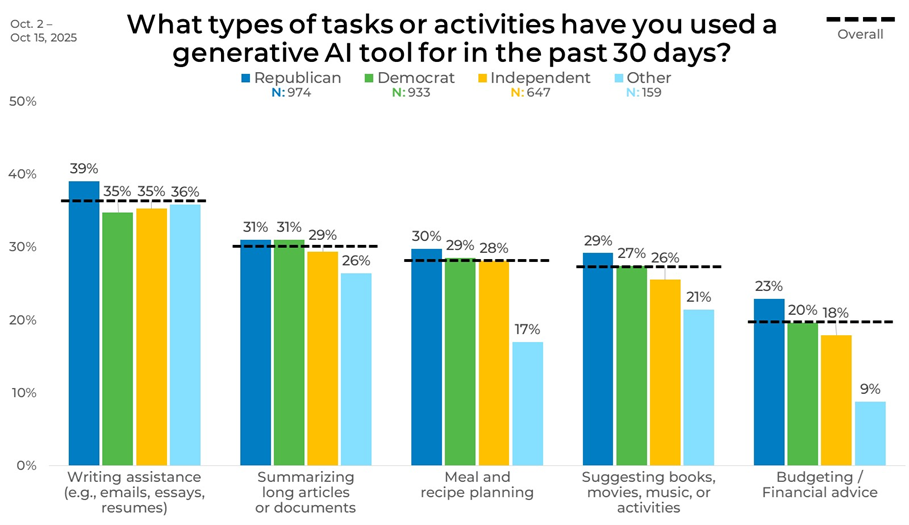
Generative AI usage is largely consistent across political affiliation. Writing assistance is used by 39% of Republicans and 35% of both Democrats and Independents, while summarizing long content stays near 30% across groups. Meal and recipe planning also varies little, ranging from 28% to 30%.
Differences remain modest overall. Budgeting and financial advice is highest among Republicans at 23%, compared with 20% of Democrats and 18% of Independents.
Region
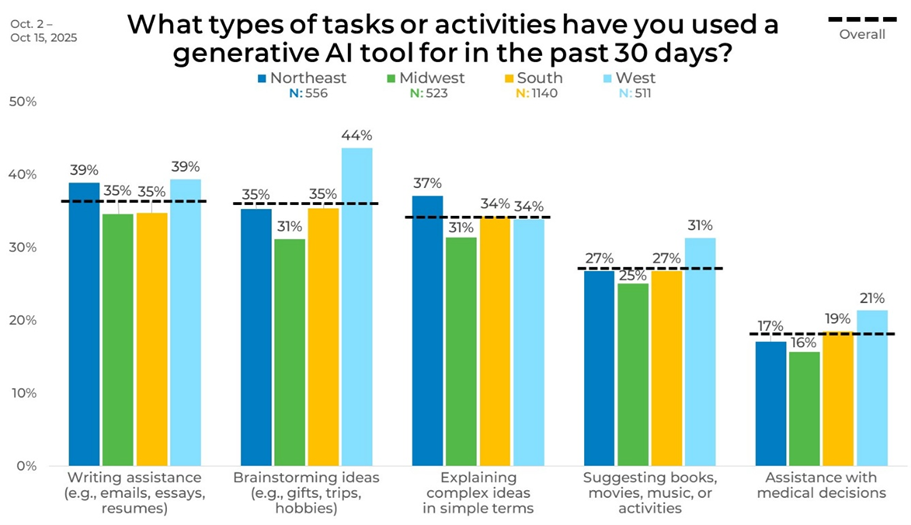
Regional differences show a few clear standouts in how people are using generative AI. Writing assistance is highest in the Northeast and West at 39%, compared with 35% in the Midwest and South, while brainstorming ideas peaks in the West at 44%, compared with 31% in the Midwest.
Ethnicity
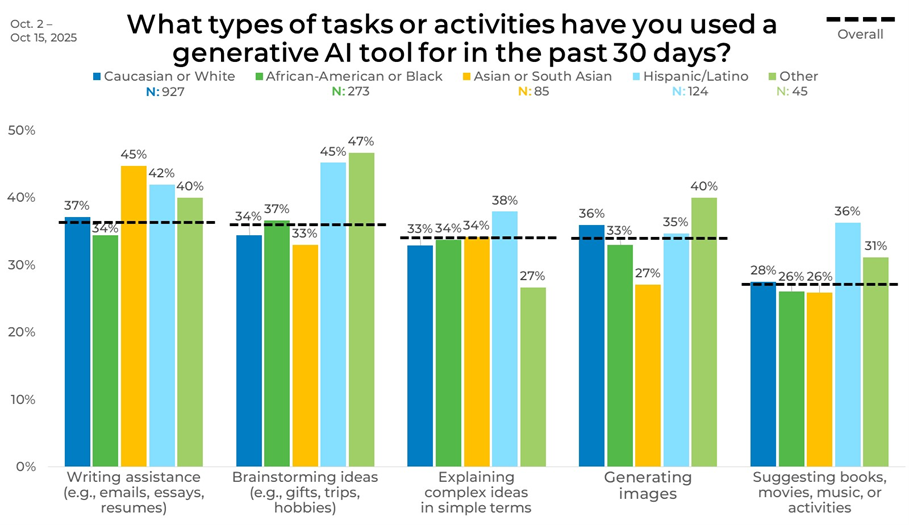
When examining data by ethnicity, we found that writing assistance is reported by 45% of Asian or South Asian respondents and 42% of Hispanic/Latino respondents, compared with 37% of Caucasian respondents and 34% of African American respondents. Brainstorming ideas is highest among Hispanic/Latino (45%) respondents.
Generating images is most common among Caucasian respondents (36%), while Asian or South Asian respondents report lower use (27%). Entertainment suggestions stand out among Hispanic/Latino respondents at 36%, compared with 28% among Caucasian respondents and 26% among African American respondents.
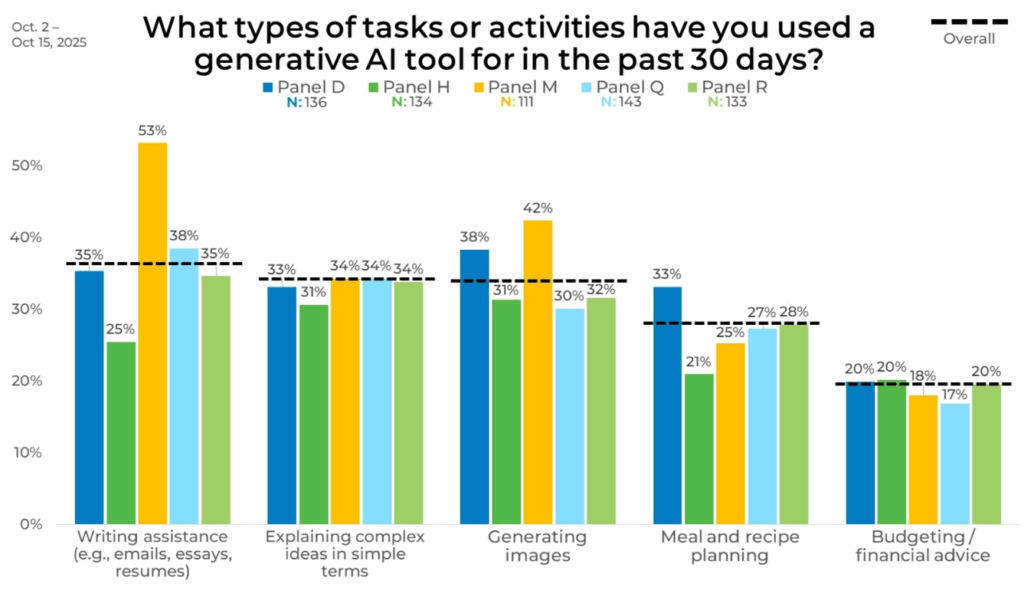
Panel
Panel differences are most pronounced for writing assistance and image generation, with writing assistance ranging from 25% in Panel H to 53% in Panel M and image generation spanning 30% in Panel Q to 42% in Panel M. Other activities remain tightly aligned by comparison, as explaining complex ideas stay between 31% and 34% and budgeting holds within a narrow 17% to 20% range.
This is a good reminder that how you build your sample really matters. Strategic blending helps avoid the bias that can sneak in when you don’t understand the attitudes and behaviors of the panels you use.


