
A New Data Quality Report, A Data Quality Pledge, and a Preview of Quirks Chicago
March 14, 2025
Signed, Sealed, and Debated: Public Opinion on Trump’s Executive Orders
March 24, 2025
The Big Dance kicks off later this week, and according to a new report from Action News, the lost productivity caused by people filling out brackets, watching the games, etc., could cause the US economy to lose around $20 billion. With this in mind, we wanted to understand how many people plan to fill out a bracket this year and how they make their selections. So, we asked respondents in our latest wave of research-on-research to let us know how likely they were to fill one out using a four-point scale and how they make their selections.
Let’s dive into what we found. (Scores are based on top-2-box scores unless otherwise noted.)
Likelihood to Fill Out a Bracket for March Madness
Overall
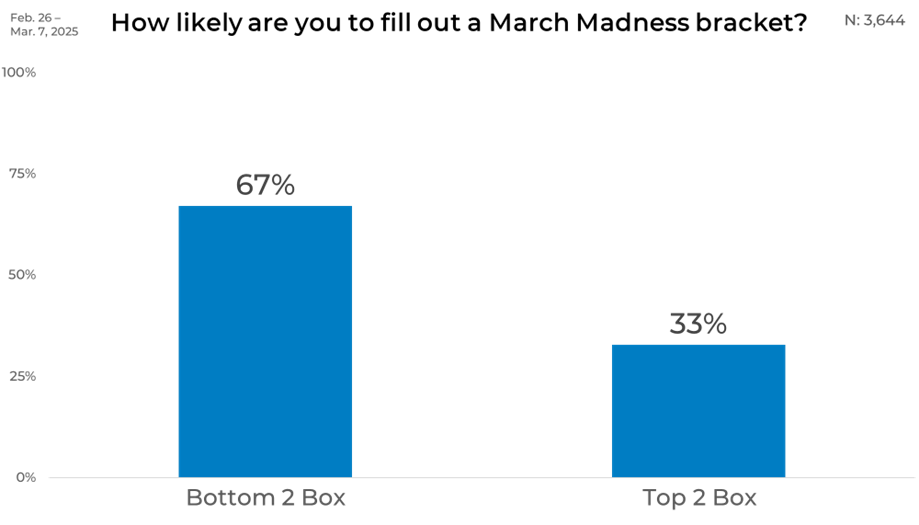
Overall, 33% of respondents indicated they were likely to fill out a bracket, while 67% were unlikely to do so. While this was a bit of a surprise, it highlighted that while bracket participation is a popular tradition, it remains an activity embraced by a minority of the general population.
Gender
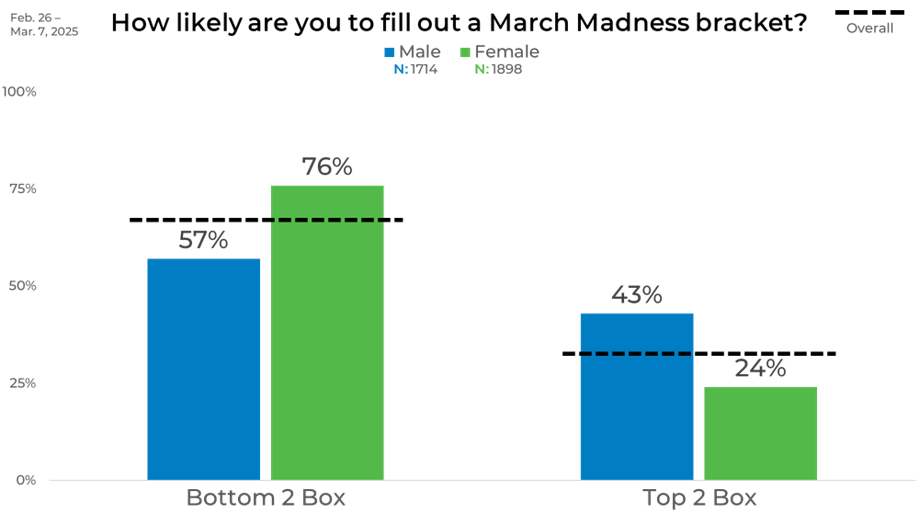
Looking at data by gender, we found males were far more likely to fill out a bracket than females. Among men, 43% reported they were likely to fill out a bracket, compared to only 24% of women. Conversely, 76% of women were in the unlikely, compared to 57% of men.
Age
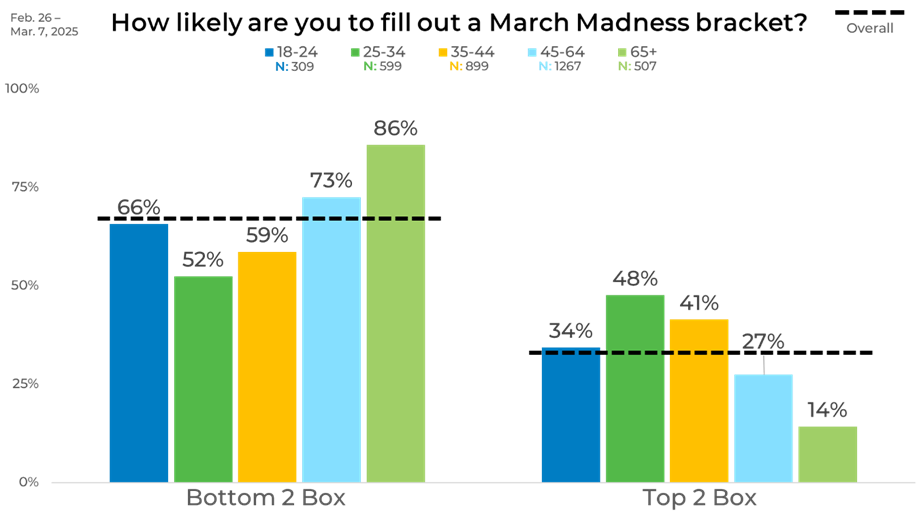
Age played a significant role in the likelihood of filling out a bracket, with interest peaking among those aged 25-34 at 48%. Participation was also relatively high among 35-44-year-olds at 41%, while the youngest group (18-24) had a slightly lower likelihood at 34%.
Interest dropped significantly among older respondents, with only 27% of those 45-64 and 14% of those 65 and older likely to participate. This pattern highlights that young adults, particularly those aged 25-34, are the most engaged in filling out brackets, with participation dropping significantly as age increases.
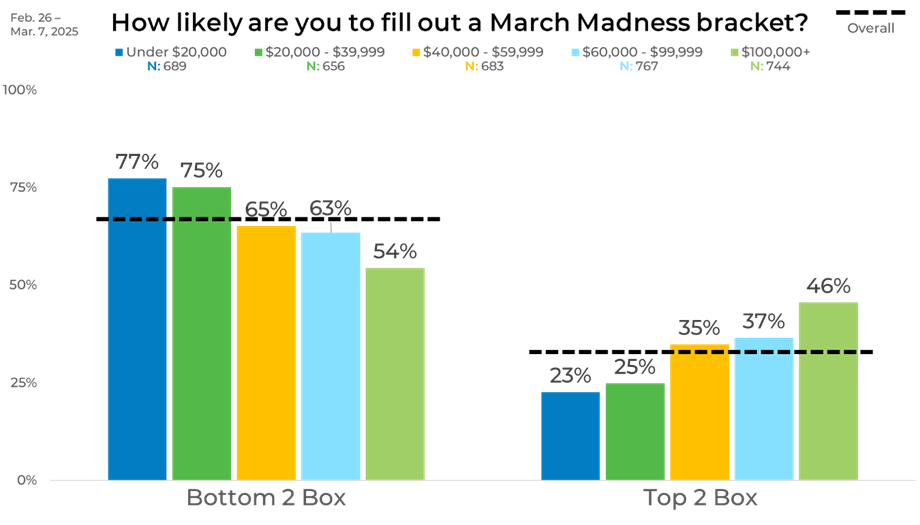
Income
The likelihood of filling out a bracket was also influenced by income level, with the possibility increased with income. Those earning under $20,000 had the lowest likelihood of filling out a bracket at 23%, whereas those making $100,000 or more had the highest at 46%. Middle-income groups fell in between, with participation rates ranging from 25% to 37%.
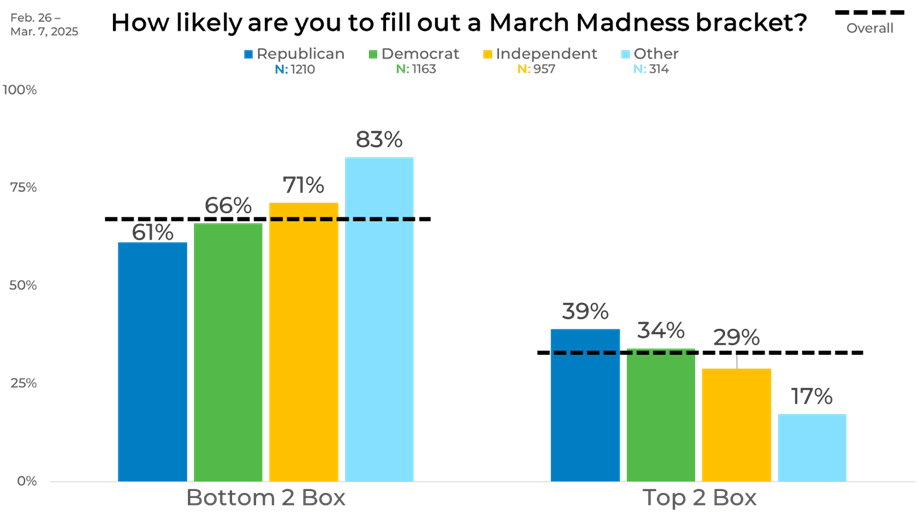
Political Affiliation
Political affiliation also influenced whether a respondent would fill out a bracket. Republicans had a slightly higher likelihood of filling out a bracket, at 39%, compared to Democrats, at 34%, and Independents, at 29%. The majority of each group, however, were unlikely to participate in filling out a bracket.
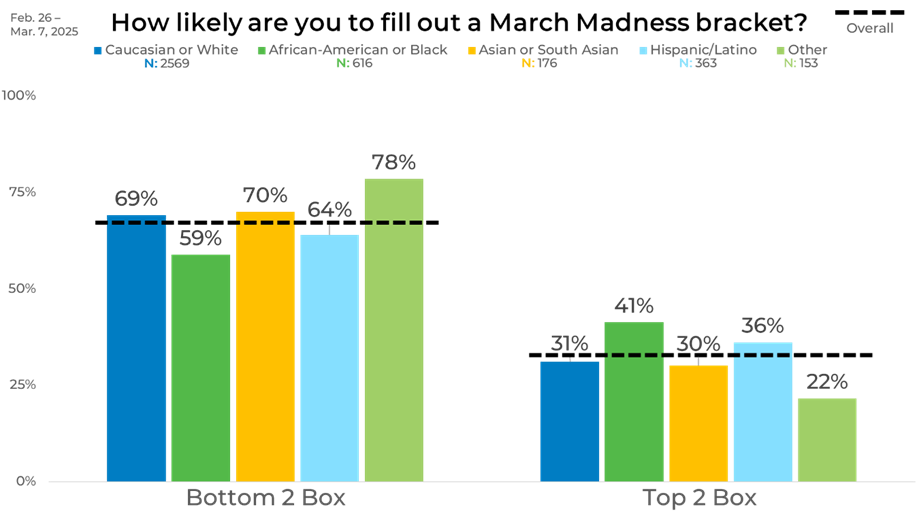
Ethnicity
Bracket participation showed noticeable differences among racial and ethnic groups. African-American respondents were the most likely to participate, with 41%. Hispanic/Latino respondents followed at 36%, while Caucasians and Asian/South Asian respondents had slightly lower participation rates at 31% and 30%, respectively.
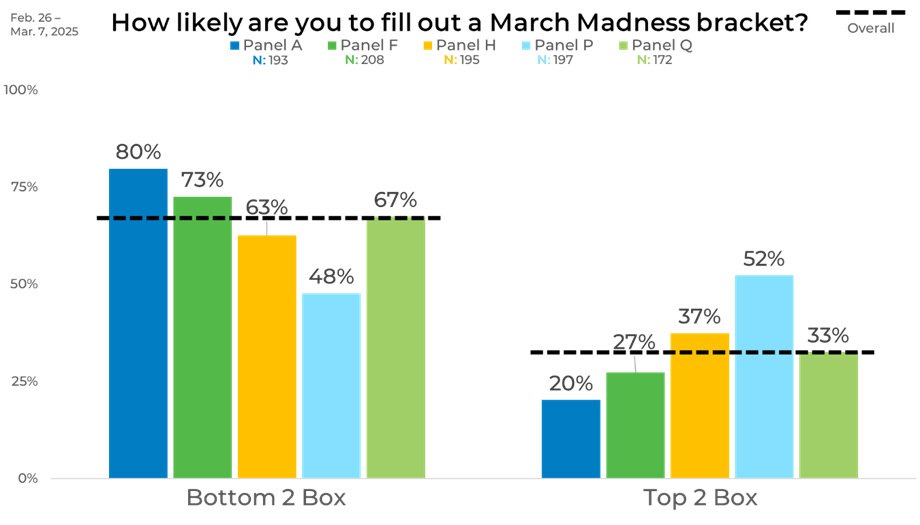
Panel
Breaking down the likelihood of filling out a bracket by panel showed considerable variation, highlighting how different panels can produce drastic results. Panel P had the highest bracket participation rate at 52%, more than double that of Panel F, which came in at just 20%. Panel A and Panel H had moderate participation levels at 37% and 36%, respectively, while Panel Q was also on the lower end at 27%. The 32-percentage-point gap between the most and least engaged panels shows how much reported interest can vary and how your results can differ because of panel selection.
Making Your Team Selections
When filling out a March Madness bracket, we found that respondents rely on various methods to make their picks. Some take a data-driven approach, while others go with their gut or make selections based on team mascots. To better understand these decision-making strategies, we asked respondents who indicated they were likely to fill out a bracket how they typically make their selections.
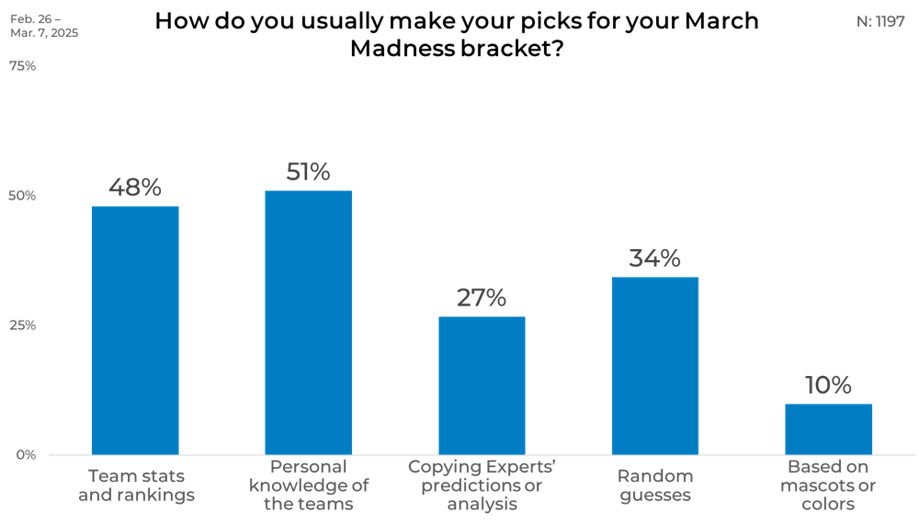
Overall
Overall, the most common approach was using personal knowledge of the teams, with 51% of respondents selecting this method. Close behind was picking based on team stats and rankings at 48%. Other methods included making random guesses (34%), copying expert predictions (27%), and selecting teams based on mascots or colors (10%).
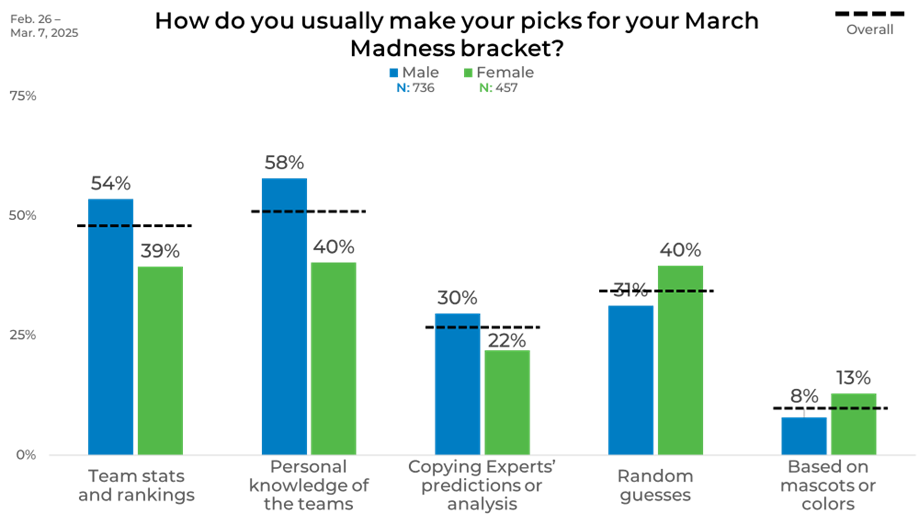
Gender
Gender has an impact on how respondents approach their brackets. Males were more likely to rely on personal knowledge (58%) and team stats (54%), while females were less likely to use these methods, with 40% and 39% respectively. Instead, females were more inclined to make random guesses (40%) compared to 31% of males. The slightest difference was in choosing teams based on mascots or colors, with 13% of women and 8% of men using this approach.
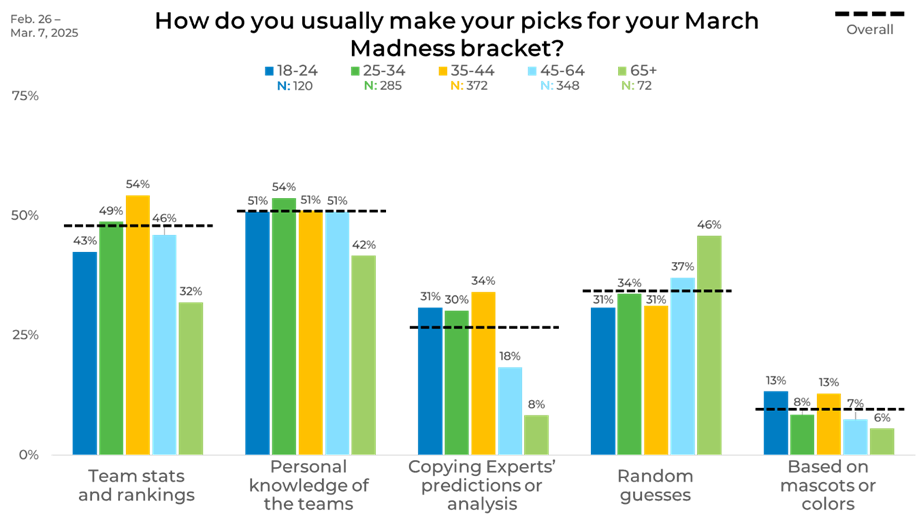
Age
Similar to how participation in filling out the brackets was influenced by age, so was team selection. The 35-44 age group had the highest reliance on team stats at 54%, while the 65+ group had the lowest at 32%. Personal knowledge remained a popular method across all age groups, peaking at 54% for 25-34-year-olds and dipping to 42% among those 65 and older. Younger participants (18-24) were more likely to copy expert predictions (31%), whereas this method was least used by those 65 and older at just 8%. Random guessing increased with age, with the highest rate among the 65+ group at 46%.
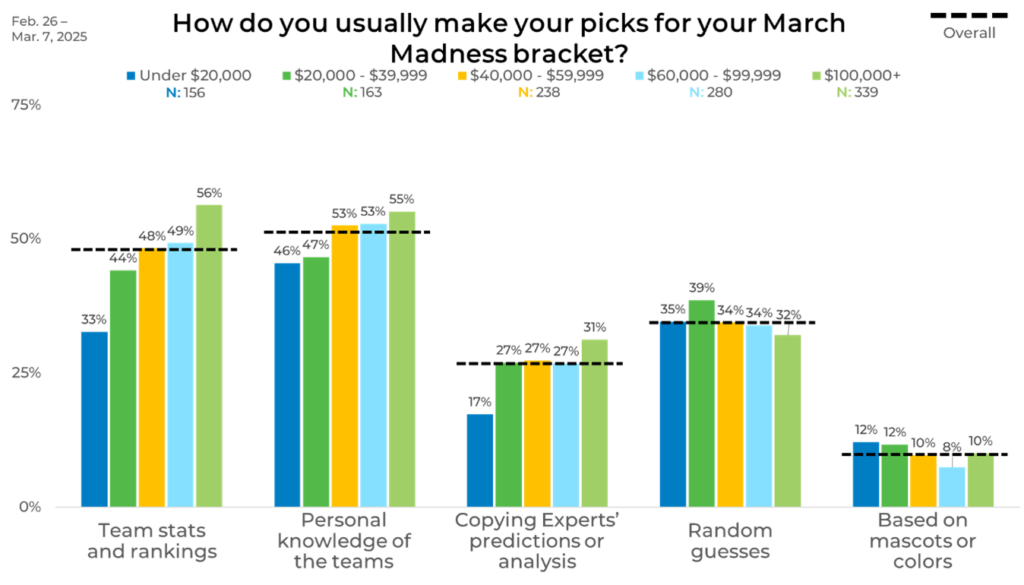
Income
Income levels also impacted bracket strategies, with higher-income respondents most likely to rely on team stats (56%) and personal knowledge (55%). At the same time, lower-income groups were slightly less reliant on these methods. Those earning under $20,000 were the least likely to use stats (33%) and most likely to make random guesses (35%). Copying expert predictions remained relatively steady across income groups, ranging from 17% among the lowest earners to 31% for the highest earners.
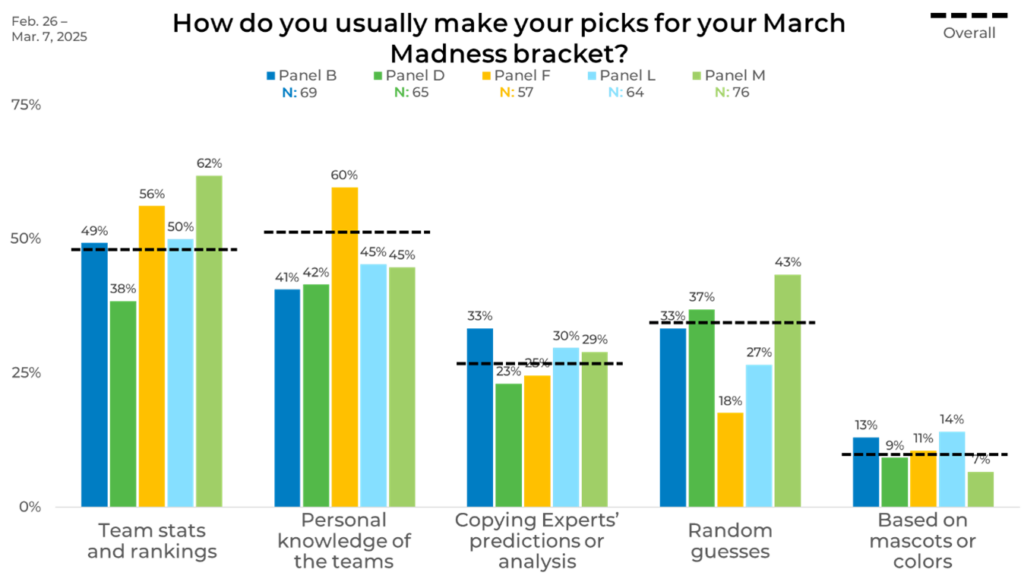
Panel
Panels not only play a major role in whether people fill out a bracket for March Madness, but they also significantly influence bracket selection. Some panels have a majority of their respondents favor stats while others lean on chance. Panel M had the highest reliance on team stats for making their bracket picks at 62%, 24 points higher than Panel D. Personal knowledge was most used in Panel F (60%) and least in Panel B (41%), with a 19-point difference. Random guessing showed the most enormous gap, with 43% in Panel M compared to just 18% in Panel F. Even choosing teams by mascots or colors varied, from 14% in Panel L to 7% in Panel M.
As we have highlighted, your panel selection can dramatically impact your data. That is why it is crucial to strategically blend your sample sources to better mitigate any bias in your data from sample selection. You can learn more about EMI’s unique Strategic Sample Blending approach by clicking the button below.


