
The Thanksgiving Edition with Gabby Blados
November 22, 2024Thanksgiving 2024: What Matters Most in Holiday Celebrations
November 27, 2024How Consumer Spending Plans for the Holidays Have Shifted Since 2023
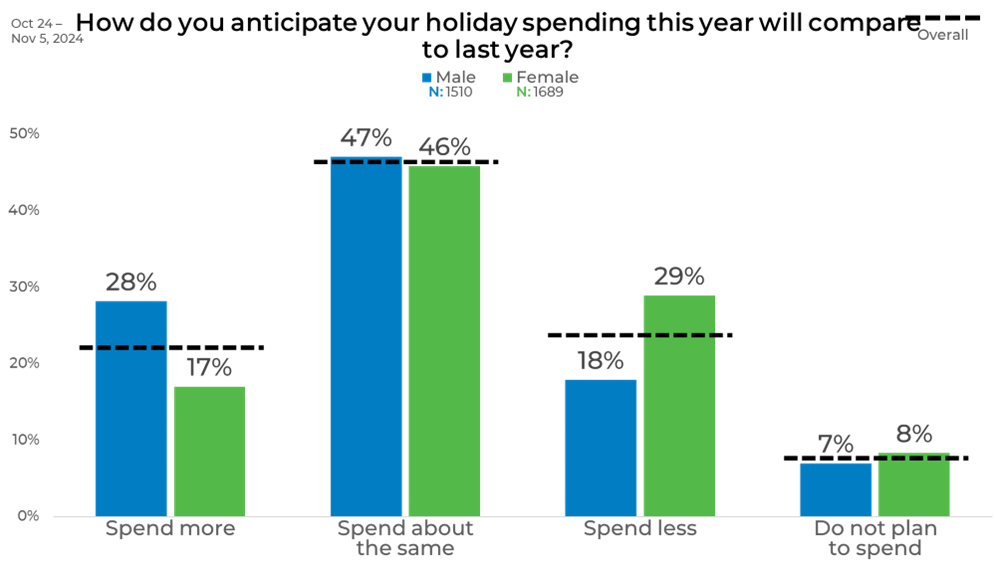
As the holiday season approaches, consumer spending trends offer valuable insight into financial optimism, caution, and priorities. Our latest data dives into how demographics like gender, age, income, and ethnicity influence holiday budgets. From maintaining traditions to scaling back, or even increasing expenses, this year’s holiday spending paints a nuanced picture of consumer behavior. At EMI, understanding these trends helps businesses adapt their strategies for a dynamic consumer landscape.
General
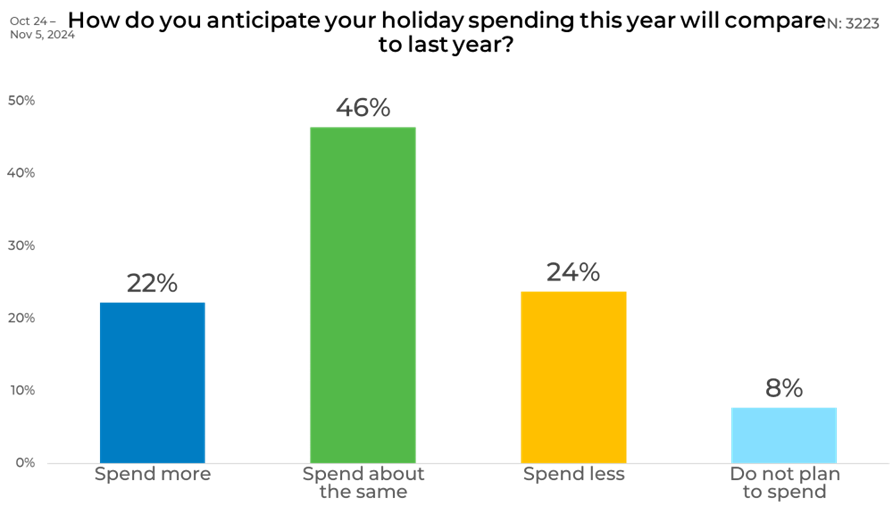
As the holiday season approaches, nearly half (46%) of respondents anticipate their spending will remain consistent with last year. However, there’s a notable split among those expecting changes: 22% plan to spend more, while a slightly higher 24% intend to cut back. Interestingly, 8% do not plan to spend on the holidays at all, highlighting a segment potentially disengaged from traditional festivities or constrained by other factors.
This mix of cautious budgeting and modest increases suggests varied consumer confidence heading into the holidays, with a steady core maintaining last year’s habits and smaller shifts at either end of the spending spectrum.
Gender
Younger age groups are leading the charge on increased holiday spending, with 35% of 18–24-year-olds and 30% of those aged 25–44 planning to spend more. In contrast, only 15% of 45–64-year-olds and just 8% of those 65 and older intend to increase their budgets.
The older generations are the most likely to maintain last year’s spending habits, particularly those 65+ (56%). Meanwhile, 45–64-year-olds stand out for their caution, with 30% planning to cut back—significantly higher than the 16%-20% range among younger groups. Across all ages, 6%-9% of respondents report no holiday spending plans, reflecting steady disengagement levels across generations.
Income
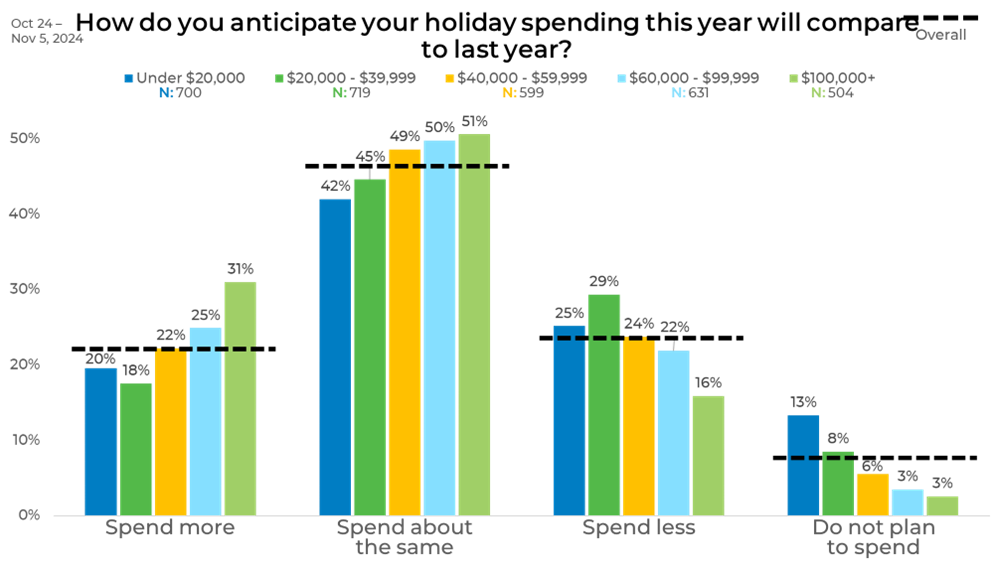
Holiday spending intentions vary sharply by income level. Higher earners ($100,000+) are the most likely to increase their spending, with 31% planning to do so, compared to just 18%-22% in the under $60,000 categories. Meanwhile, lower-income groups are more inclined to cut back—29% of those earning $20,000–$39,999 plan to spend less, versus only 16% of the $100,000+ earners.
The proportion of people who do not plan to spend on holidays decreases as income rises, from 13% among those earning under $20,000 to just 3% in the highest income bracket. Across all income groups, a steady 42%-51% intend to maintain last year’s spending habits, reflecting a common thread of stability despite varying financial circumstances.
Age
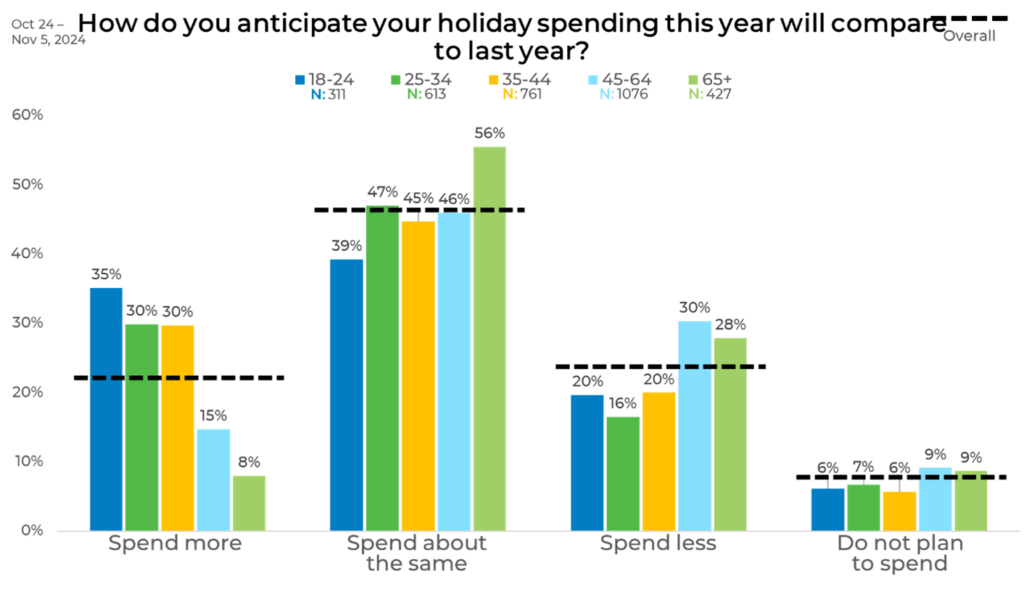
Younger age groups are leading the charge on increased holiday spending, with 35% of 18–24-year-olds and 30% of those aged 25–44 planning to spend more. In contrast, only 15% of 45–64-year-olds and just 8% of those 65 and older intend to increase their budgets.
The older generations are the most likely to maintain last year’s spending habits, particularly those 65+ (56%). Meanwhile, 45–64-year-olds stand out for their caution, with 30% planning to cut back—significantly higher than the 16%-20% range among younger groups. Across all ages, 6%-9% of respondents report no holiday spending plans, reflecting steady disengagement levels across generations.
Ethnicity
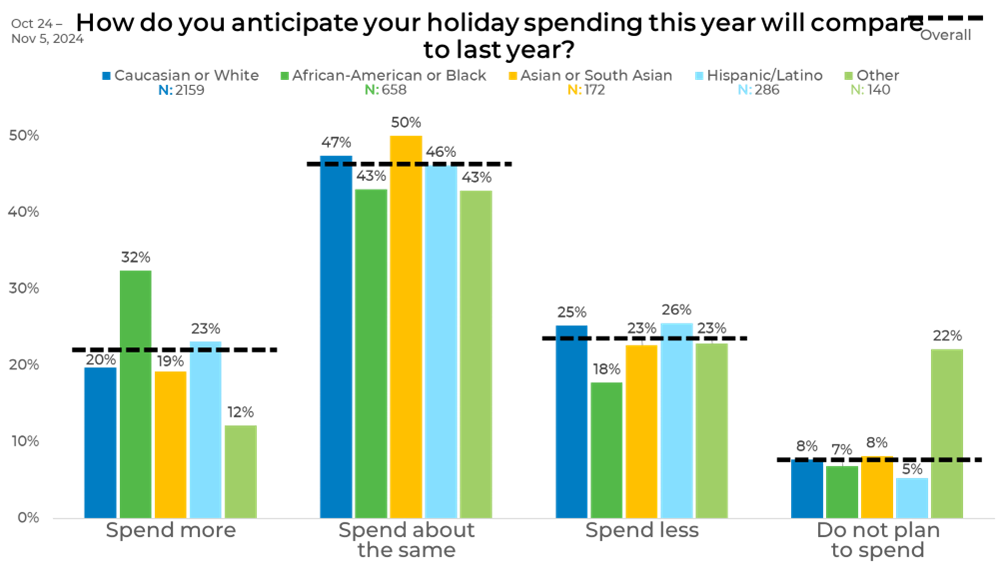
African-Americans stand out as the most optimistic group, with 32% planning to increase their holiday spending—far higher than Caucasians (20%), Hispanics/Latinos (23%), Asians/South Asians (19%), and those identifying as “Other” (12%).
Caucasians, Asians, and Hispanics are closely aligned in their plans to maintain last year’s spending, ranging from 46% to 50%. Meanwhile, the “Other” group has the highest percentage (22%) opting out of holiday spending entirely—well above the 5%-8% seen in other groups.
When it comes to cutting back, Caucasians lead at 25%, closely followed by Hispanics/Latinos (26%), while African-Americans are the least likely to scale down at 18%. These patterns reveal significant contrasts in spending optimism and financial restraint across different ethnicities.
Panels
Spending intentions differ dramatically across panels, with Panel I standing out as the most optimistic—32% plan to spend more, compared to just 9% in Panel A and 16%-23% in the others. Conversely, Panel A leads in plans to cut back, with 28% intending to spend less, significantly higher than Panel I’s 18%.
Panels A and N show the highest inclination to maintain last year’s spending habits (55% and 53%, respectively), while Panels C and I are tied at 43%-44%. Interestingly, the proportion of those not spending on holidays remains low and consistent across panels, ranging from 7% to 10%. These disparities suggest varying levels of confidence or financial flexibility among the panels.
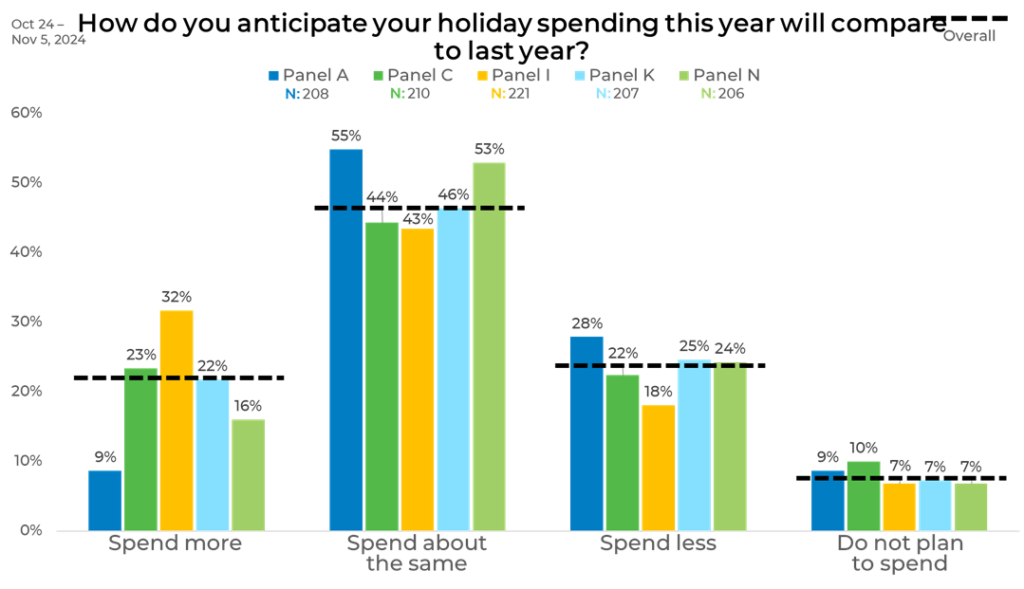
This is an excellent representation of where quality data sampling matters. At EMI, we prioritize strategically blending sample sources to balance demographics as well as behaviors and attitudes to ensure that we provide the most representative and accurate data. Download The Sample Landscape: 2024 Edition to better understand how panels differ from one another and how they impact your data.
Holiday spending trends reflect a blend of optimism and caution, driven by factors like income, age, and demographic background. Understanding these patterns allows businesses to align their strategies with consumer behaviors, ensuring they meet customer needs effectively. At EMI, we’re proud to provide the insights that help brands navigate complex consumer landscapes, delivering actionable data that drives results this holiday season and beyond.


