A Closer Look at 2024 Election Preferences by Demographic
November 4, 2024
The Dirty Secret of Data Quality with Roddy Knowles
November 11, 2024How Confident Are Voters? Insights on the 2024 Election Choices
Even though folks have who they want to vote for figured out, they might not be 100% confident.
In this follow-up to our recent blog on voter choices for the 2024 election, we explore voter confidence in candidate selection across demographics. With Election Day here, understanding confidence levels offers insight into the stability of voter support and the potential for last-minute changes. From age and income to political affiliation and panel data, these findings highlight varied certainty levels that could impact the final results.
General
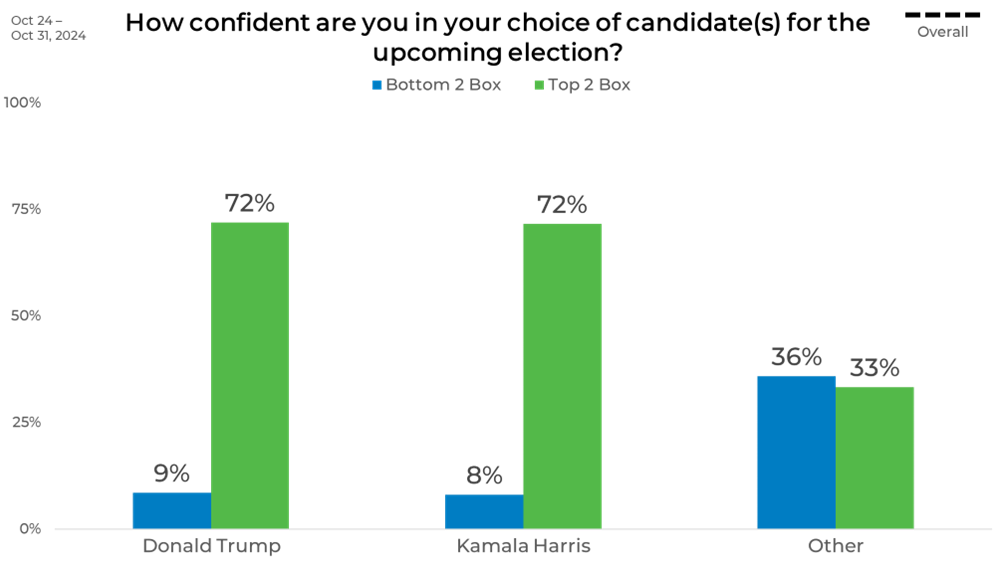
Confidence levels in candidate choice reveal strong commitment among supporters of both main candidates, with 72% of Trump and Harris voters expressing high confidence (top two box) in their selection. This shared 72% indicates robust confidence among the bases of both candidates, suggesting solidified support heading into the election. However, those backing “Other” candidates show a strikingly different confidence pattern, with only 33% in the top confidence bracket and a significant 36% in the bottom confidence category. This split suggests that voters leaning toward alternative candidates feel less certain in their choice, reflecting a potential openness to reconsideration or change.
Gender
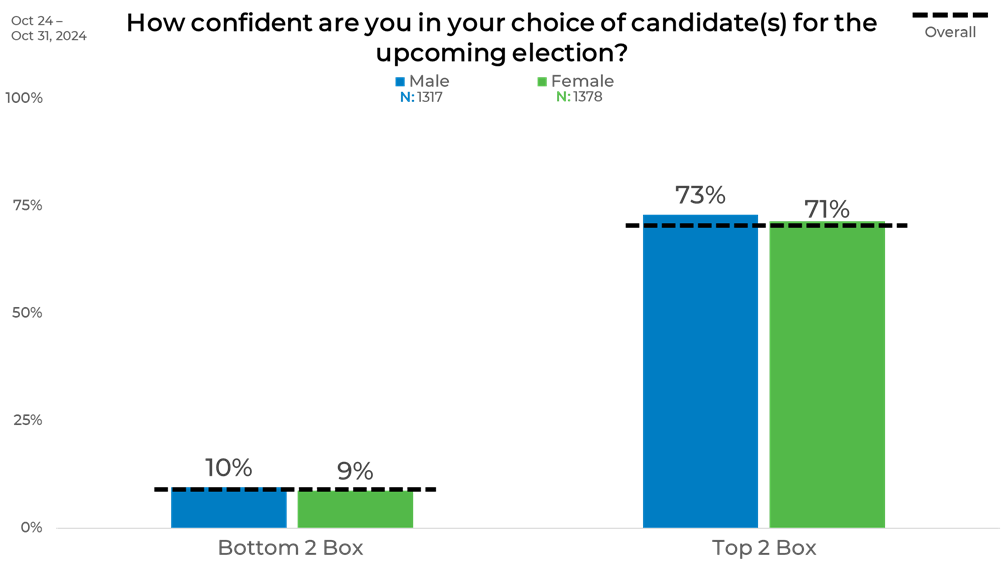
The gender breakdown shows similar levels of confidence between male and female voters in their candidate choices. Among male respondents, 73% report high confidence in their choice (top-two-box), closely matched by 71% of female respondents. This small difference suggests that confidence is relatively even across genders, with both groups showing strong commitment to their selections.
In terms of low confidence (bottom-two-box), the numbers are nearly identical as well, with 10% of men and 9% of women indicating uncertainty. These close figures indicate that gender does not play a significant role in voter confidence for this election, with both groups demonstrating comparable levels of commitment and only minimal ambivalence.
Political Affiliation
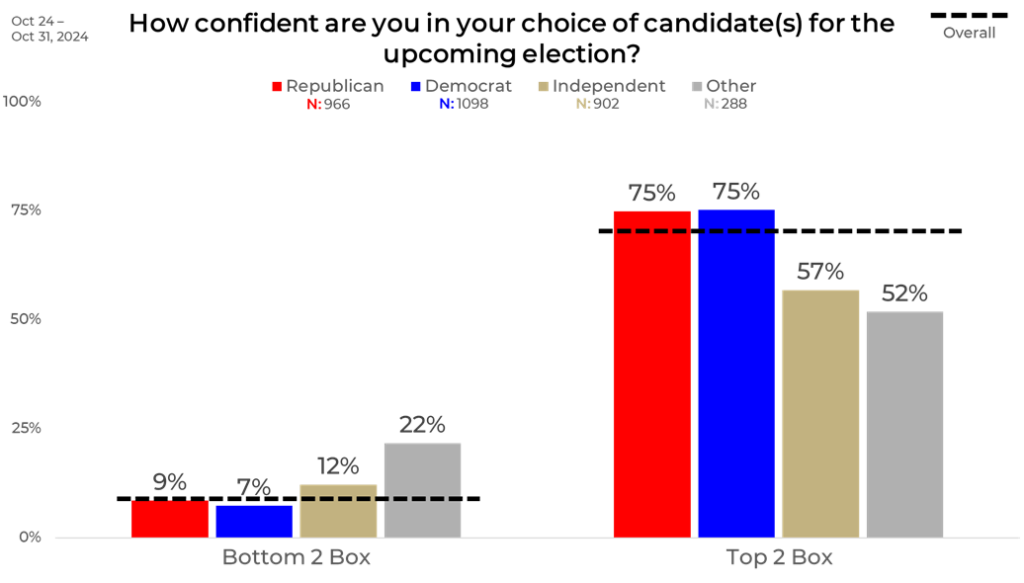
The confidence breakdown by political affiliation shows that Republicans and Democrats are highly confident in their choices, with 75% in each group reporting top-two-box confidence. This indicates solid commitment among partisans, suggesting minimal likelihood of candidate switching within these groups. Independents and “Other” party voters, however, show less certainty. Only 57% of Independents and 52% of “Other” party respondents express top confidence, while 12% of Independents and a notable 22% of “Other” voters fall in the bottom confidence bracket. This lower confidence level among nonpartisan voters suggests that these groups may be more open to changing their candidate choice as the election approaches.
Age
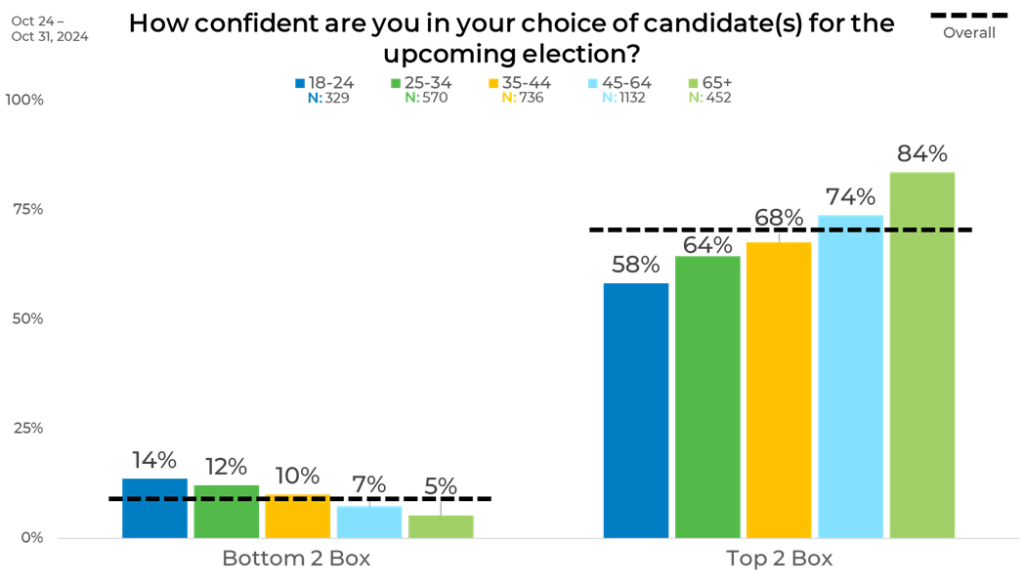
Confidence in candidate choice increases with age, with older voters showing markedly higher certainty. Among those aged 65 and older, 84% report high confidence (top-two-box), followed closely by the 45-64 group at 74%. Younger age groups, particularly those aged 18-24, display the lowest top confidence at 58%, alongside a significantly higher portion in the bottom-two-box (14%), indicating greater uncertainty in their choices. This trend suggests that older voters are more secure in their candidate selections, while younger voters show more ambivalence, potentially signaling openness to persuasion or last-minute decision shifts among younger demographics.
Income
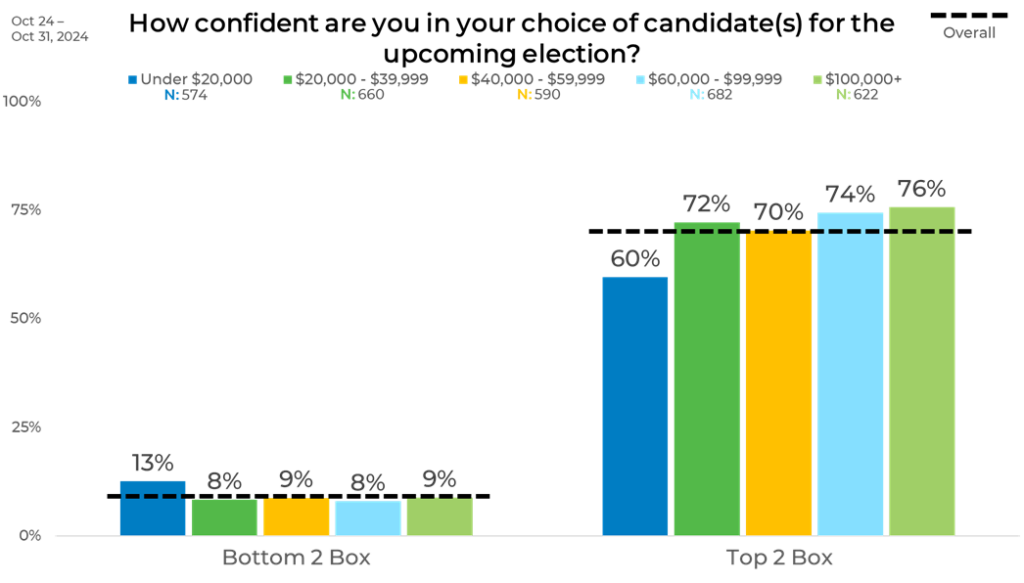
Confidence in candidate choice correlates positively with income level, with higher-income respondents reporting the greatest confidence. Among those earning $100,000 or more, 76% fall in the top-two-box (T2B) for confidence, while confidence slightly decreases for lower-income groups, with 60% of those earning under $20,000 expressing high confidence. Bottom confidence (B2B) levels are relatively consistent across income levels, ranging from 8% to 13%, with the highest uncertainty among the lowest income group. This suggests that while high-income voters are the most secure in their choices, confidence remains relatively strong across income brackets, though lower-income respondents exhibit somewhat more hesitation in their candidate commitment.
Panels
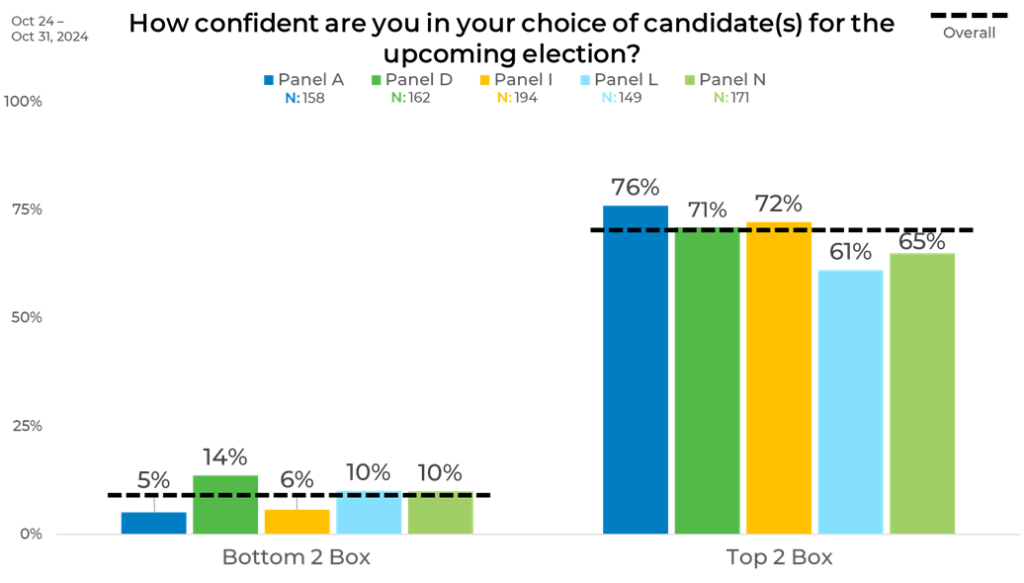
The panel data underscores significant differences in voter confidence that could lead to contrasting interpretations if only one panel’s results were analyzed. For instance, Panel A displays the strongest voter confidence, with 76% in the top-two-box (T2B) and a low 5% in the bottom-two-box (B2B). Relying on this panel alone might suggest voters are overwhelmingly certain about their candidate choice, indicating stability across the board. However, Panel L shows a very different picture: only 61% express high confidence (T2B), while 10% fall in the B2B, signaling a more uncertain and potentially changeable voter base. Panel D also reveals mixed sentiments, with 71% confident but the highest B2B (14%) of all panels, suggesting a notable portion of hesitant voters. These differences highlight how choosing a single panel could misrepresent voter confidence levels, underscoring the value of a multi-panel approach to capture the full range of voter certainty in this election.
This is an excellent representation of where quality data sampling matters. At EMI, we prioritize strategically blending sample sources to balance demographics as well as behaviors and attitudes to ensure that we provide the most representative and accurate data. Download The Sample Landscape: 2024 Edition to better understand how panels differ from one another and how they impact your data.
As a follow-up to our voter choice analysis, this breakdown of voter confidence underscores the diversity in commitment levels across demographics. While main candidates enjoy strong support from their bases, groups like independents, younger voters, and certain panels exhibit more uncertainty—an element that could tip the scales in an election as close as this one. Our multi-dimensional data offers critical insight into where voter confidence stands today and how shifting preferences may impact the election.


