
Next Stop – The Red Planet
February 24, 2023
Intellicast S6E6 – Schlesinger or Should We Say Sago
March 3, 2023Three. Years. Later.
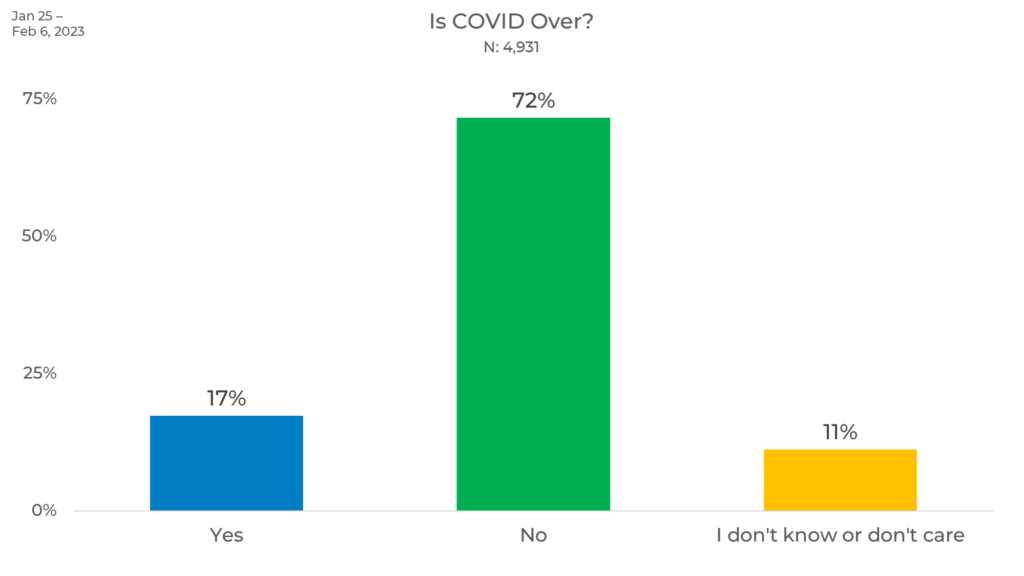
What some might consider to be the start of the COVID-19 pandemic, March 2020, is officially three years behind us. We’re seeing fewer people wearing masks and more people social gathering, so does that mean COVID is over? In our latest round of research-on-research, we asked respondents just that. Here is what we found:
Overall, 72% of people say that COVID is not over. In fact, people are 55% more likely to feel that COVID is not over with only 17% of people thinking that COVID is over.
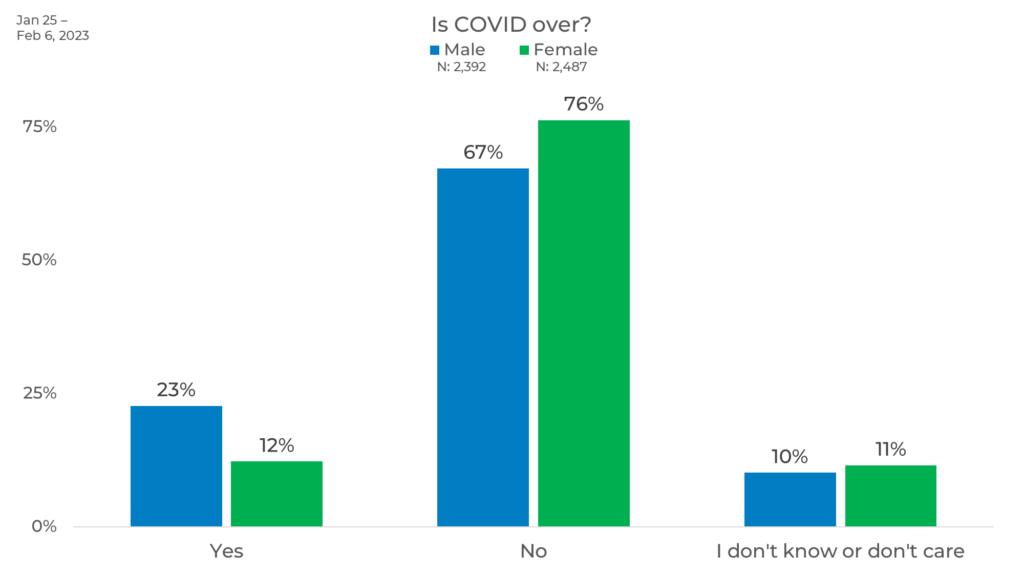
Gender
Females are 9% more likely than males to say that COVID is not over. It is interesting to note that both males and females had a similar, small percentage of responses that say they do not know or care if COVID is over.
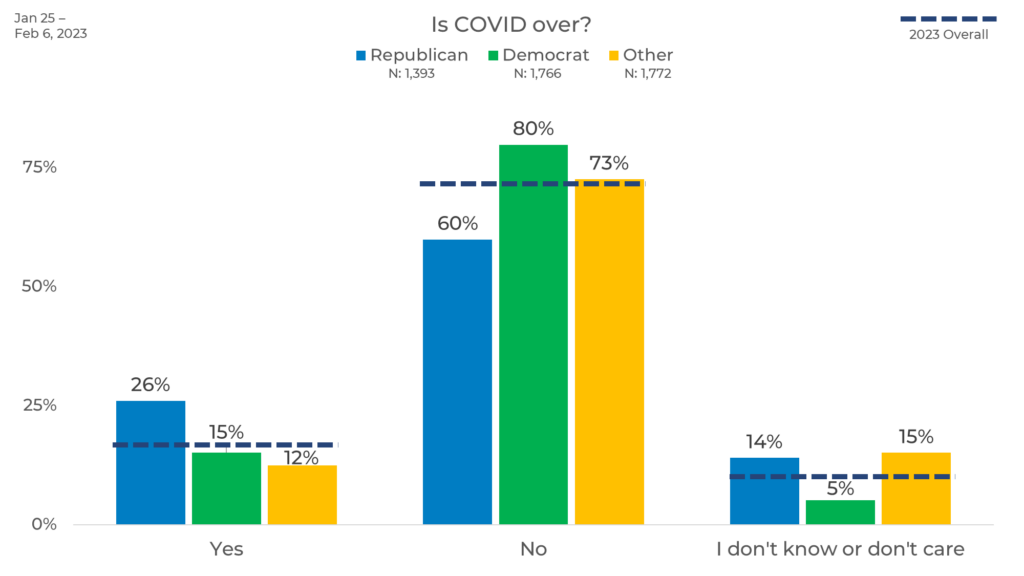
Political Affiliation
We see that the majority of all parties do not believe that COVID is over. However, Republicans are 11% more likely than Democrats to believe that COVID is over. Republicans are also 12% less likely to say that COVID is over than the overall average.
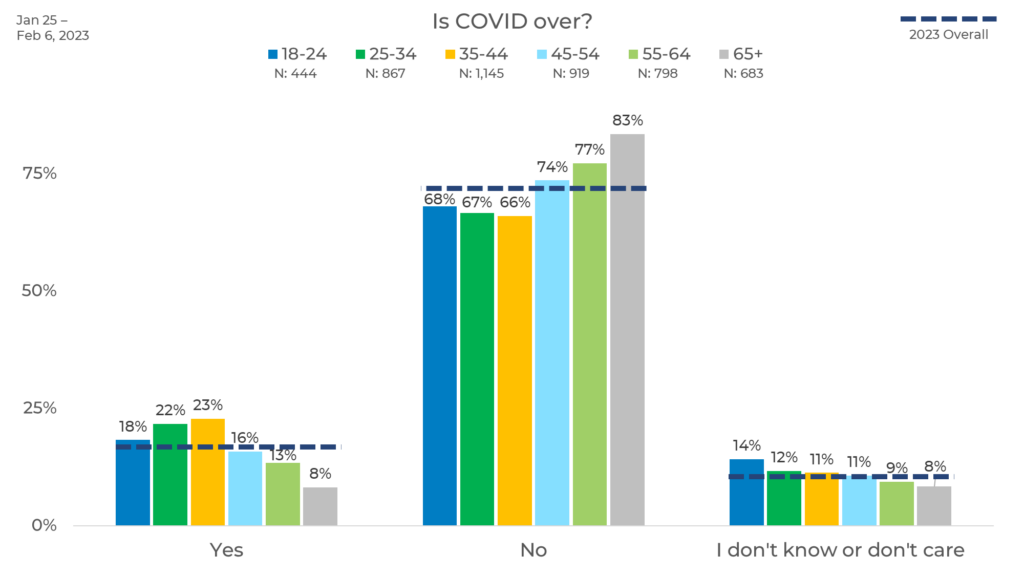
Age
When it comes to age, we find that 35-44-year-olds are the most likely to think that COVID is over at 23%. Respondents age 65+ are the least likely to think that COVID is over at 8%. In fact, those age 65+ are 6% more likely to say that COVID is not over than any other age at 83% (11% higher than the overall average.)
Ethnicity
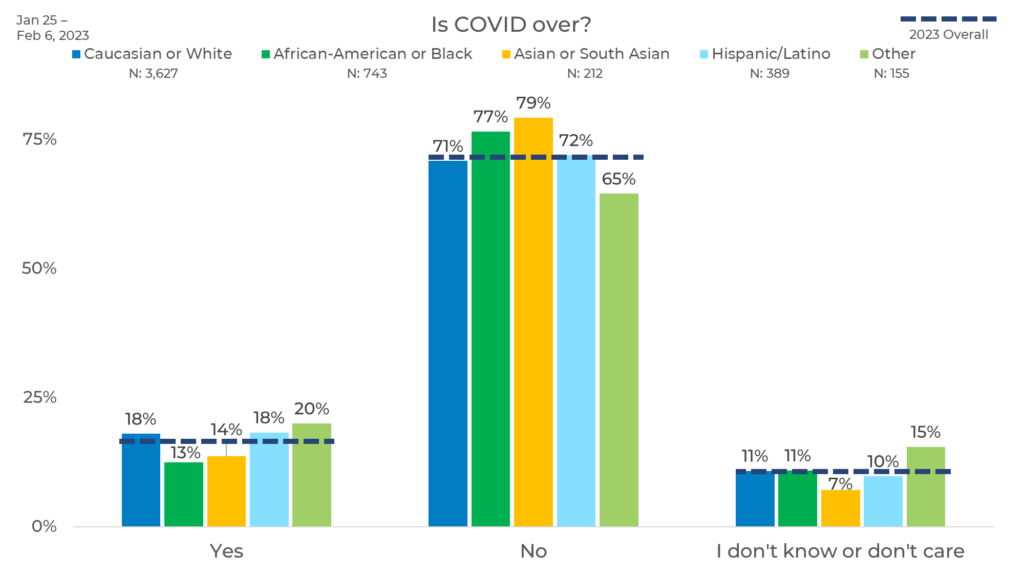
When looking at response by ethnicity, Asians or South Asians are most likely to say that COVID is not over, followed by African Americans and Hispanics, respectively. Respondents who identify as “Other” are least likely to say that COVID is not over at 65% (7% less likely than the overall average.)
Income
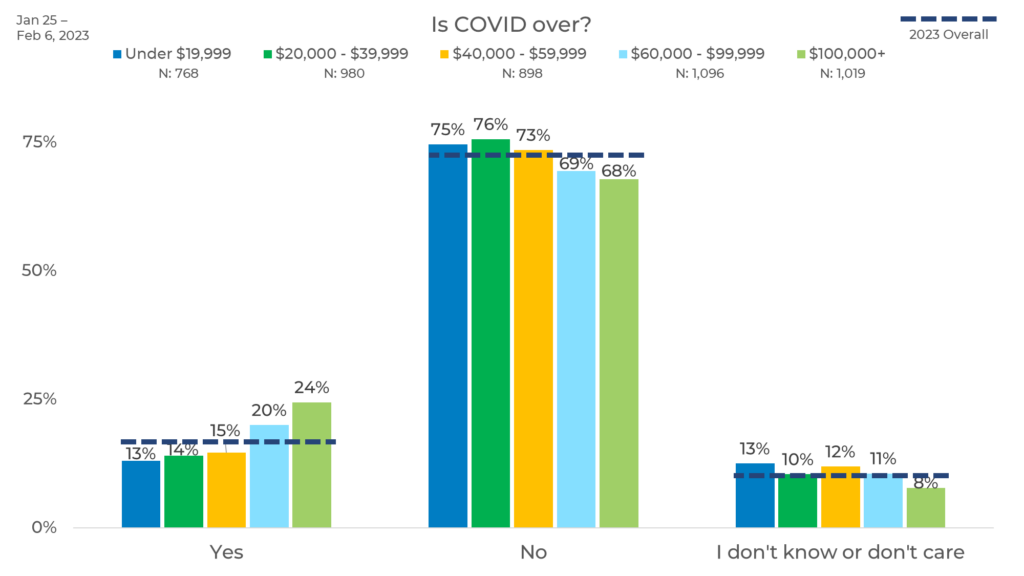
We also looked at response by income. Here we see that the higher the income a person has, the more likely they are to think that COVID is over. In fact, those with incomes above $100,000 are 11% more likely to think COVID is over than those with incomes below $19,999, and 7% more likely to think COVID is over than the overall average.
Panel
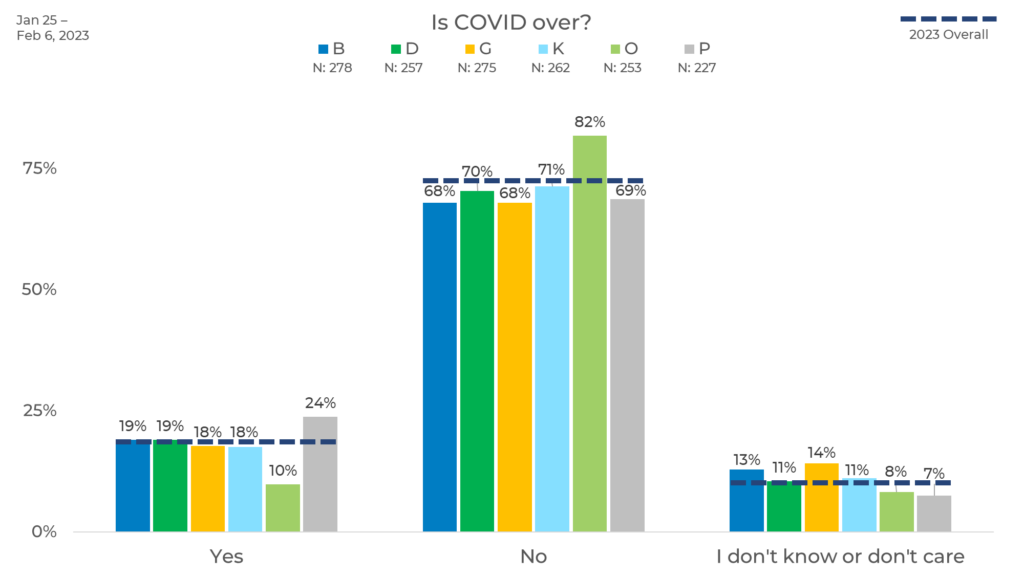
Finally, we compared responses by panel. We see the largest differences between Panels O and P where Panel P is 14% more likely to think COVID is over than Panel O. Panel O is the most likely to think COVID is not over, 11% more likely than other panels, and 10% more likely than the overall average. Panel P is the most likely to think COVID is over at 7% higher than the overall average.
These differences can be due to variation in panel makeup, management, incentive, or a myriad of other reasons. For instance, Panel O may have more respondents age 45+, who we know from above are more likely to say that COVID is not over.
As we see in this blog, opinions can vary greatly by demographic and panel. This is why strategic sample blending is the best practice to ensure any changes in your data are due to actual shifts in opinion rather than inconsistencies in your sample.


