Is This Trump’s Third Run or His Indictment?
February 13, 2023
Intellicast S6E5 — Back-to-Back Breaking News
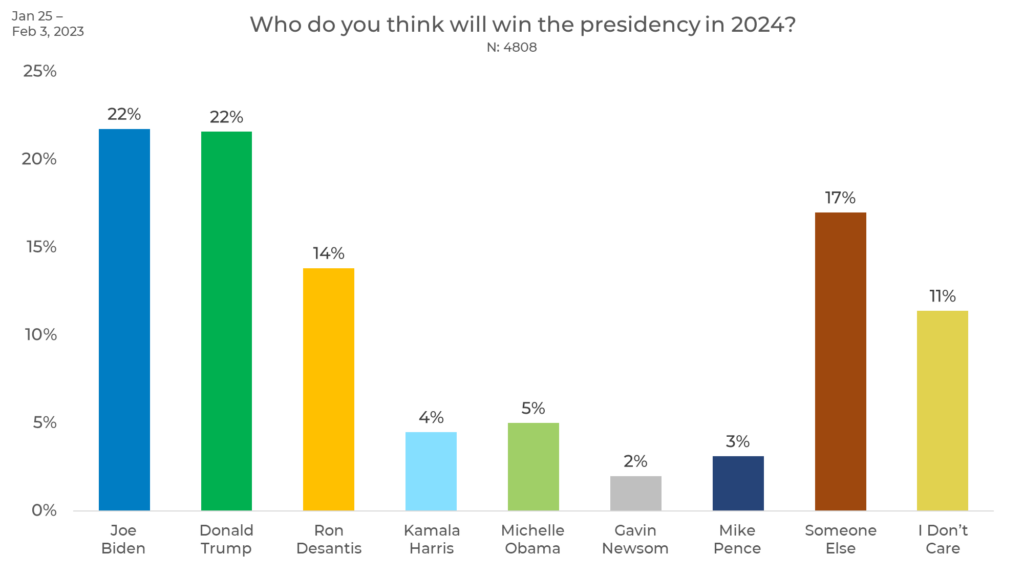
February 22, 2023The State of the Union address was last week. Whether we’re ready for it or not, the next year and a half promises to be full of presidential and political opinions. So, let’s get it started. In our latest round of research-on-research, we asked people who they think will win the presidency in 2024. The options included Joe Biden, Donald Trump, Ron Desantis, Kamala Harris, Michelle Obama, Gavin Newsome, Mike Pence, “Someone Else,” or “I Don’t Care.”
Overall, people think Biden or Trump are the most likely to win, at 22% each. The next highest response is “Someone Else,” followed by Ron Desantis, and “I Don’t Care,” respectively.
Gender
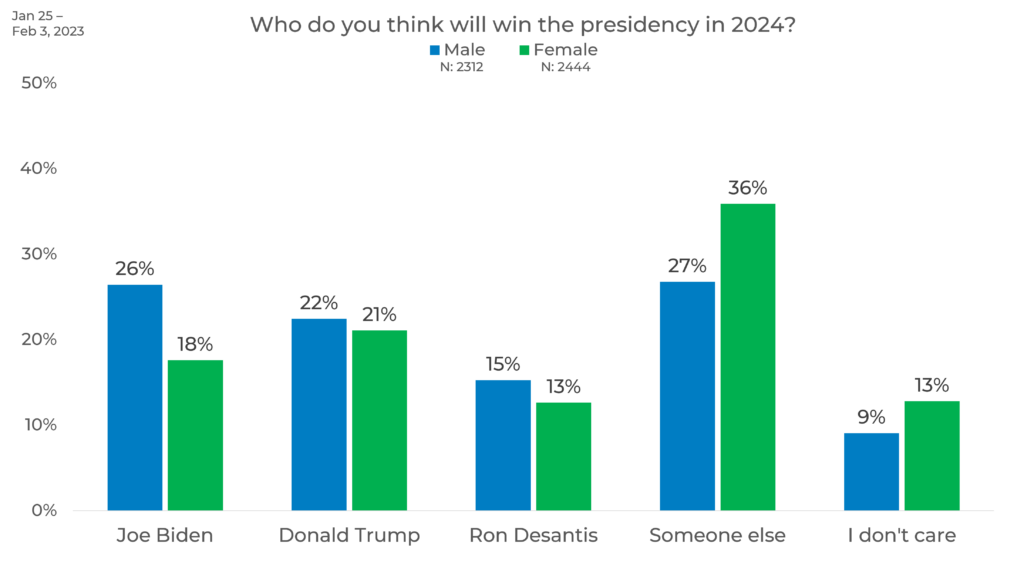
When it comes to gender, males are more likely than females to believe that Joe Biden, Donald Trump, or Ron Desantis will win the presidency. Females are 9% more likely than males to believe that someone other than Biden, Trump, or Desantis will win. Females are also 4% more likely than males to say they don’t care.
Political Affiliation
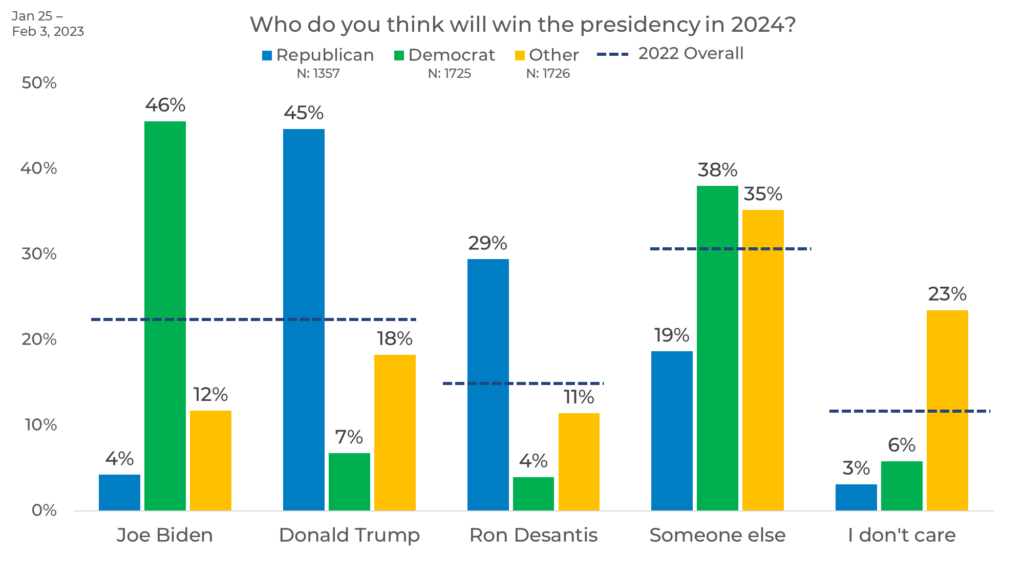
As expected, there are significant variations in opinion by political affiliation. Democrats are the most likely to believe that Biden or someone other than Biden, Trump, or Desantis will win the presidency. Democrats are 42% more likely than Republicans to believe Biden will win and 24% more likely than the overall average to believe that Biden will win. They are also 19% more likely than Republicans to think someone else will win.
Republicans are the most likely to think that Trump or Desantis will win. They are 38% more likely than Democrats to think that Trump will win and 23% more likely than the overall average to think that Trump will win. Republicans are also 25% more likely than Democrats to think that Desantis will be president. People who identify with parties other than Republican or Democrat are most likely to say they don’t care.
Age
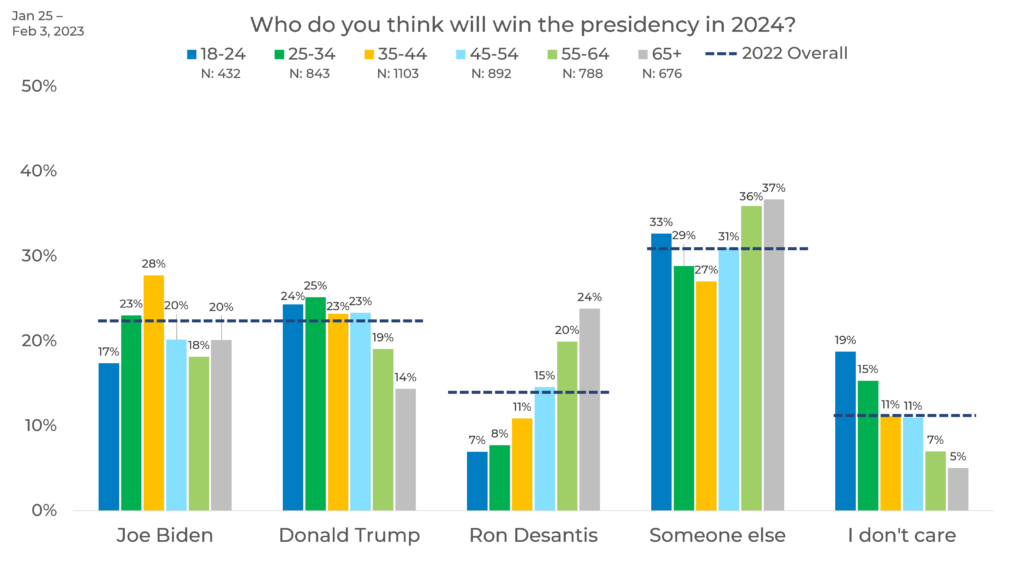
We also looked at response by age. Here, we see a trend that the older a person is, the more likely they are to care or have an opinion on who will win the presidency. Additionally, the older a person is, the more likely they are to believe that Desantis will win. The older a person is, the less likely they are to think that Trump will win.
We also found that people age 55+ are the most likely to think someone other than Biden, Trump, or Desantis will win the election. People aged 25-44 are the most likely to think Biden will win (6% higher than the overall average.) People aged 25-34 are the most likely to think Trump will win (3% higher than the overall average.)
Ethnicity
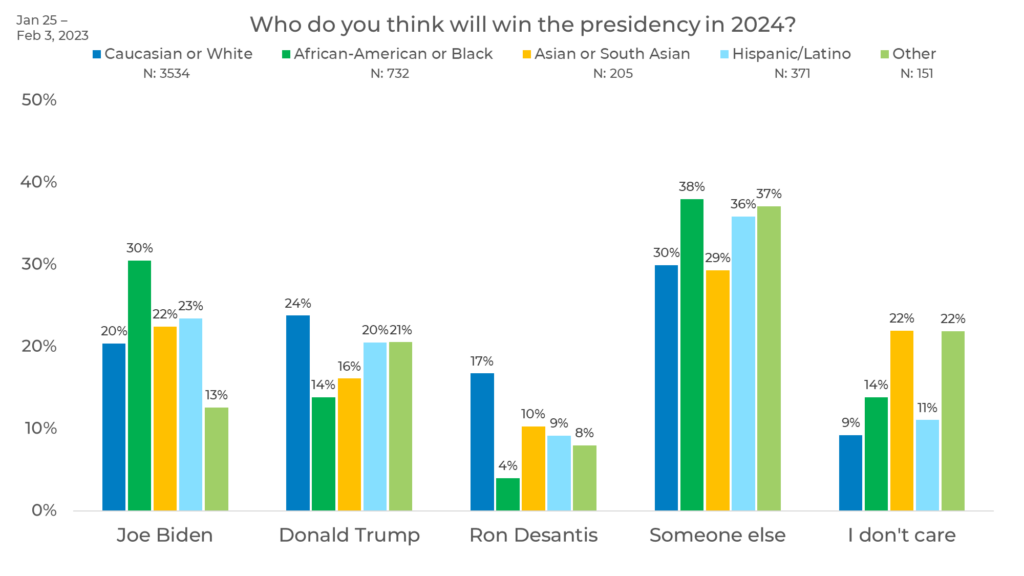
When it comes to ethnicity, African Americans are the most likely to think Biden or someone other than Biden, Trump, or Desantis will win. Asians and those who responded “Other” are most likely to not care or have an opinion on who they think will win. Caucasians think someone else, or Trump will win. However, they are 6% more likely to think someone else will win than to think Trump will win. Hispanics think someone else, or Biden will win. They are 13% more likely to think someone else will win than to think Biden will win. In fact, all ethnicities are the most likely to think someone else will win.
Income
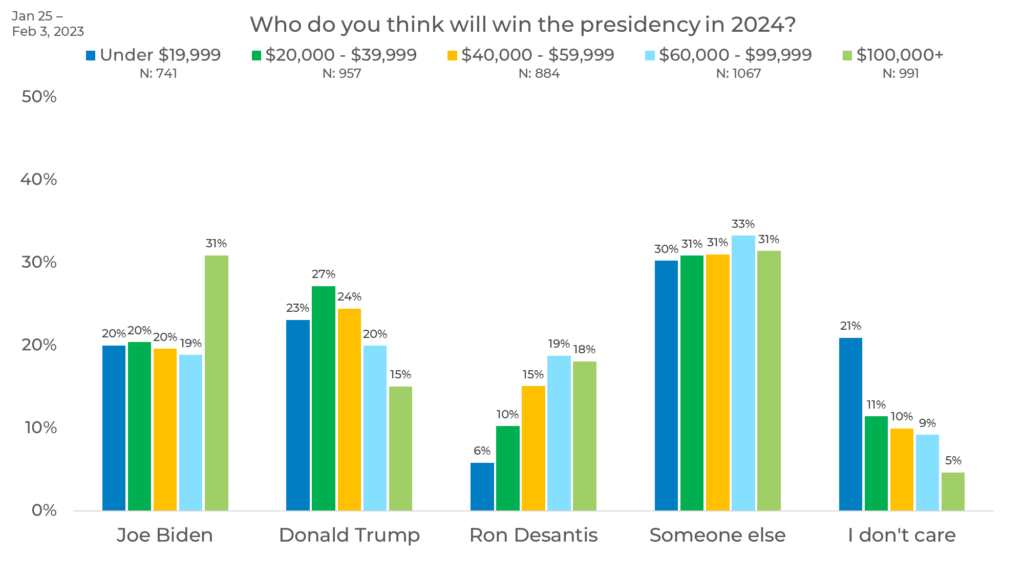
When looking at income, we see that all income levels are most likely to think someone other than Biden, Trump, or Desantis will win with only a maximum of 3% difference across incomes. Those with incomes of $100,000+ are 11-12% more likely than any other incomes to think Biden will win. We also see a trend where the higher a person’s income is, the more likely they are to think Desantis will win. People with higher incomes are also more likely to care or have an opinion on who will win the presidency.
Panel
Finally, we looked at response by panel. Here, we see that Panels A, E, and O are most likely to believe that someone other than Biden, Trump, or Desantis will win. Panels P and Q think that Biden will win. Panel L thinks that Trump will win.
We also see up to a 22% difference between panels as shown between Panels O and P when looking at those who think Biden will win the 2024 election. Additionally, we see responses up to 10 percentage points higher and 8 percentage points lower than the overall average.
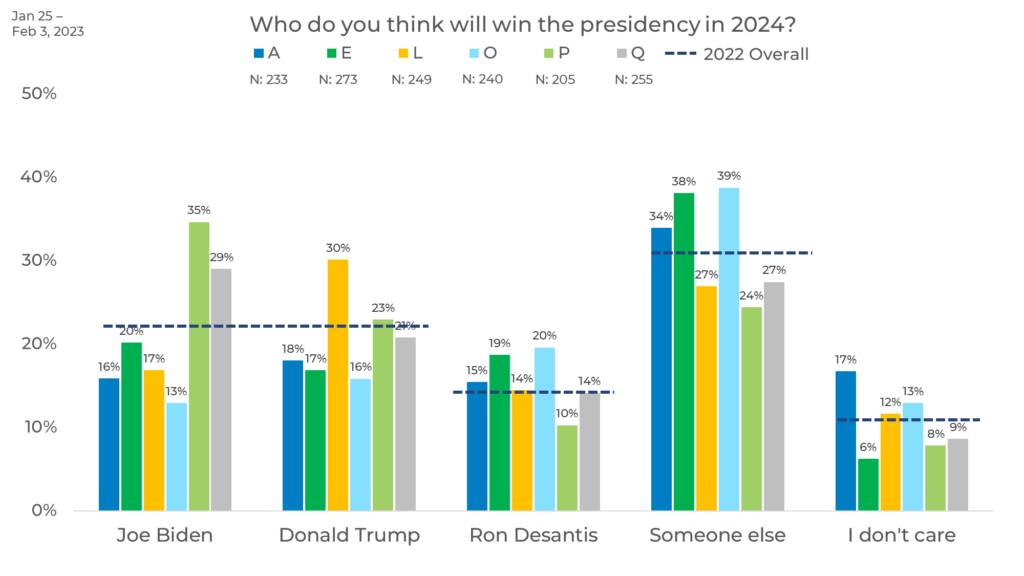
As we see in this blog, public opinion can vary greatly by demographic and panel. This can be due to differences in panel management, incentive, etc. and can have significant impacts on your data. For instance, someone monitoring Joe Biden’s campaign would have very different understandings if they only used Panel P versus if they only used Panel O. That’s why strategic sample blending is a best practice to ensure any changes in your data are due to shifts in opinion rather than inaccuracies in your sample.

