
Respondent Experience and How It Can Be Improved
May 20, 2020
Intellicast S3E27 – A NEXT 2020 Preview, Sports, and WFH Fails
May 29, 2020In addition to EMI’s ongoing research of the sample landscape and our evaluation of differences in sample sources, we also research opinions around current events or hot topics. For the last couple of years, we have researched perceptions around marijuana legalization.
Legalization by Gender
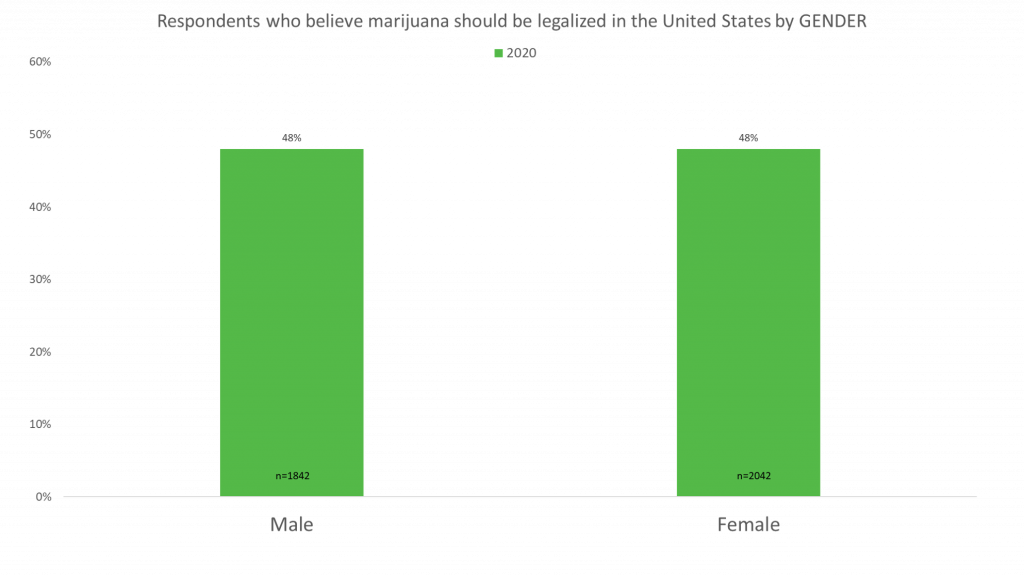
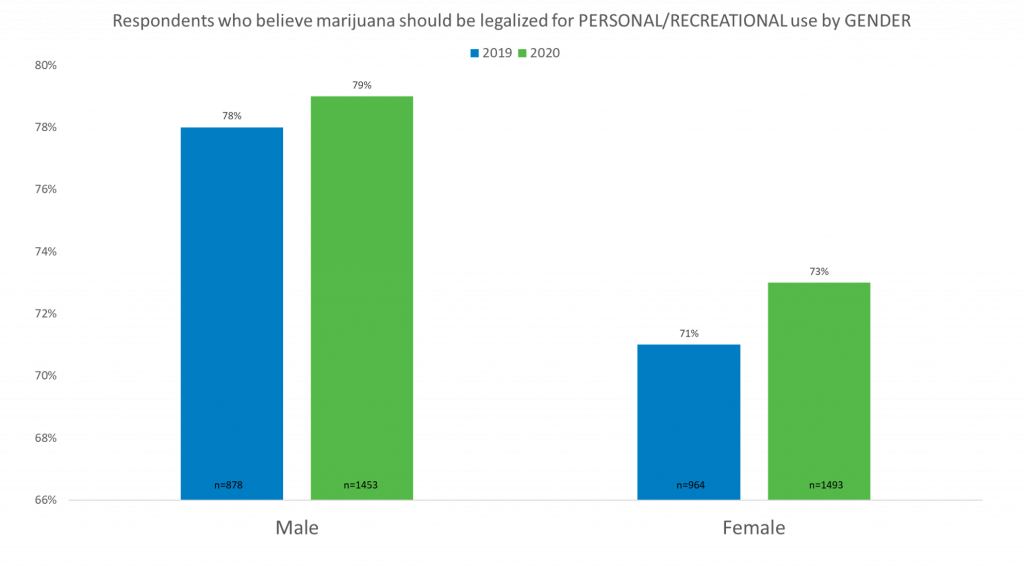
In our latest rounds of research, we found that both males and females believe marijuana should be legalized at the same percentage.
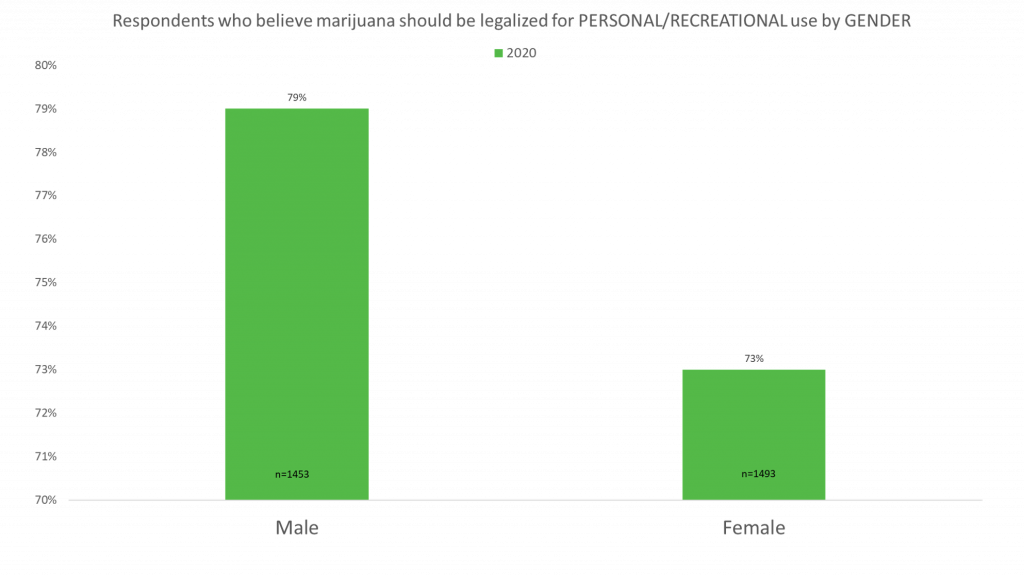
However, they differ in their acceptance of its use. Males are 6% more likely to believe that marijuana should be legalized for personal/recreational use than Females.
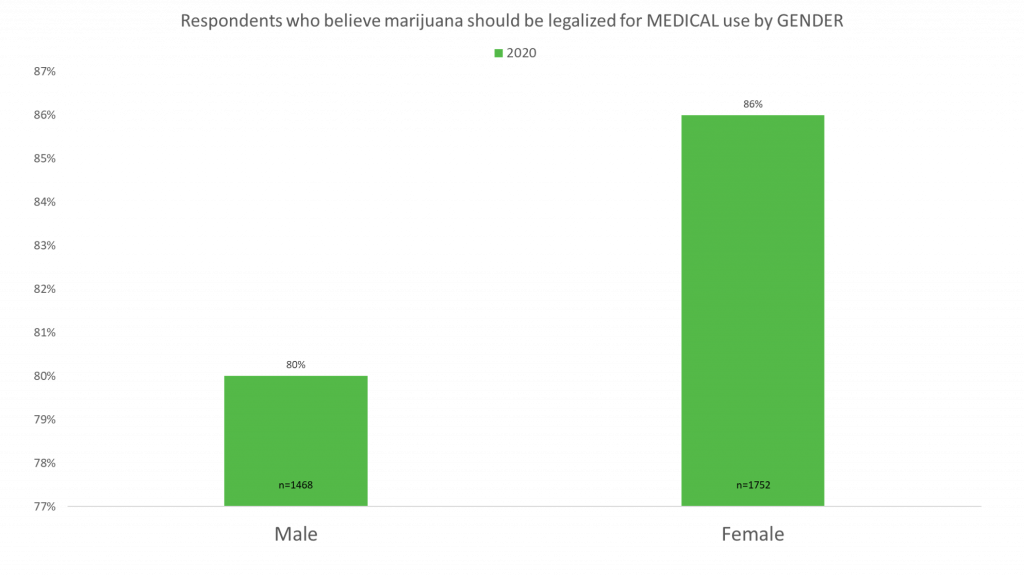
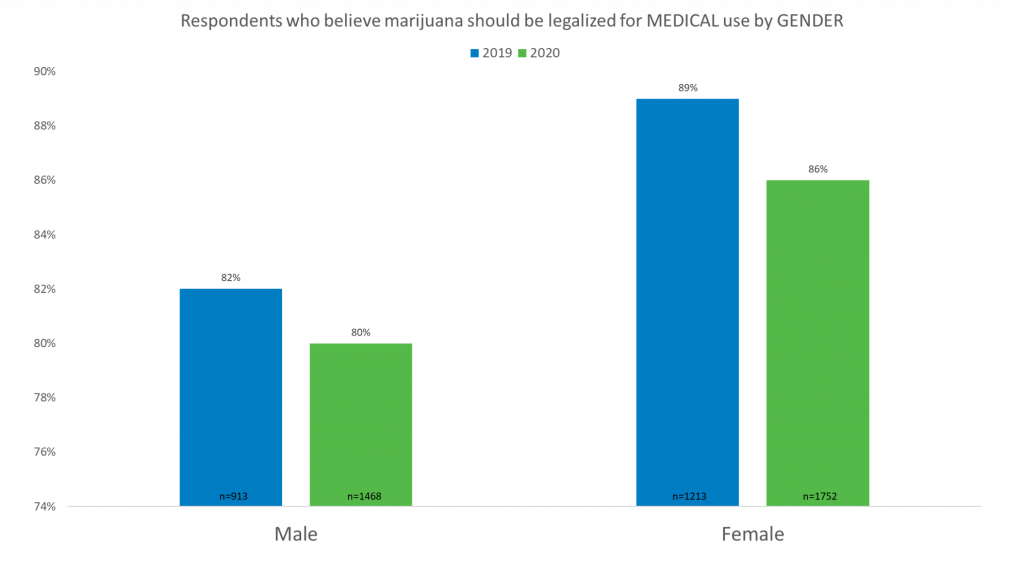
Females are 6% more likely to believe that marijuana should be legalized for medical use than Males.
Compared to 2019
We also compared our results year-over-year. Surprisingly, we found that there was a decrease, 7% in Males and 3% in Females, in those who believe marijuana should be legalized.
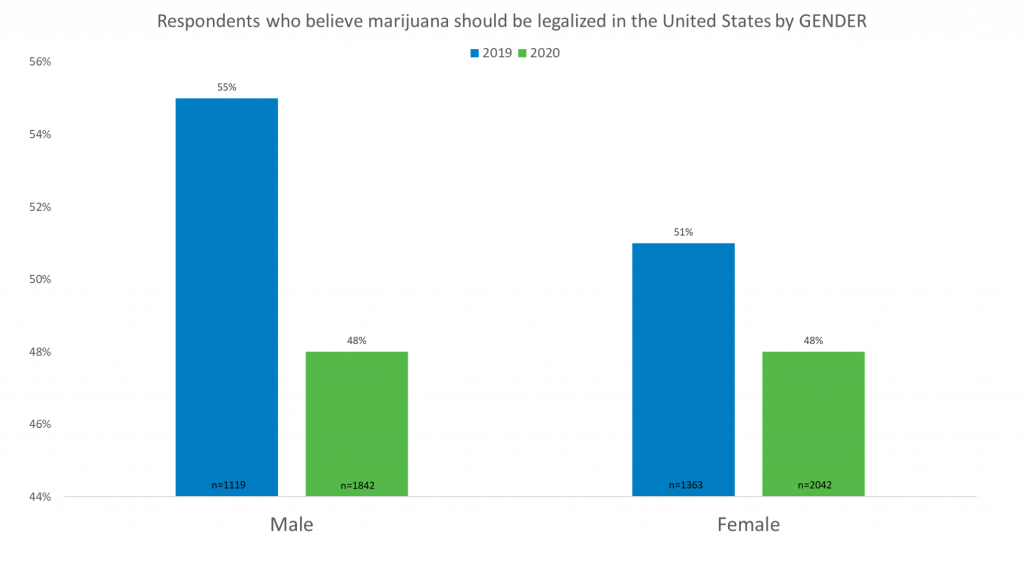
While the number of respondents who believe marijuana should be legalized declined year-over-year, the number of respondents (from both genders) who believe that marijuana should be legalized for personal/recreational use increased in 2020.
Finally, we saw a decrease year-over-year in the number of respondents (both male and female) who believe that marijuana should be legalized for medical use.
Legalization by Age
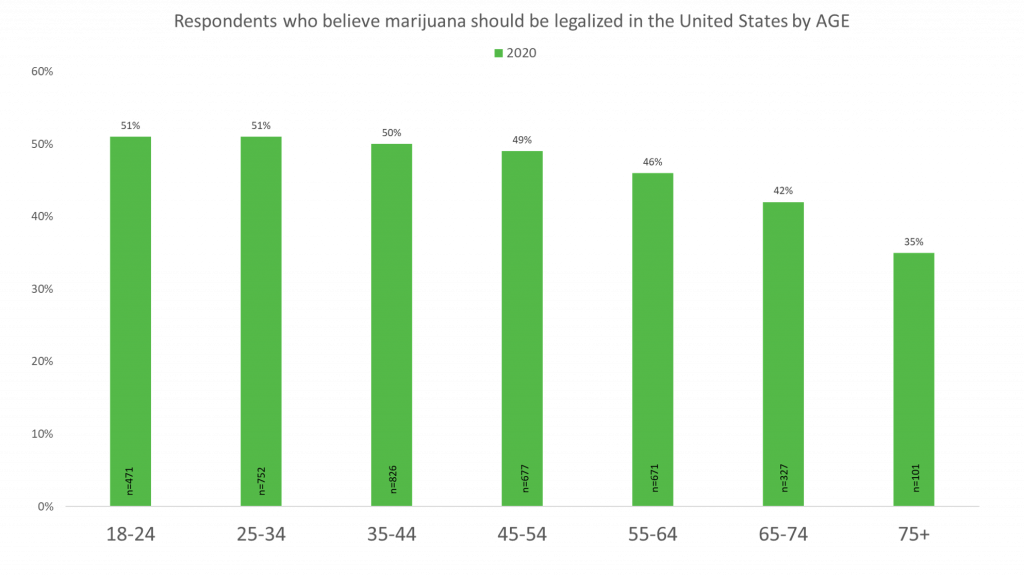
When segmenting the results by age groups, we weren’t surprised to find that younger respondents were more likely to be in favor of marijuana legalization.
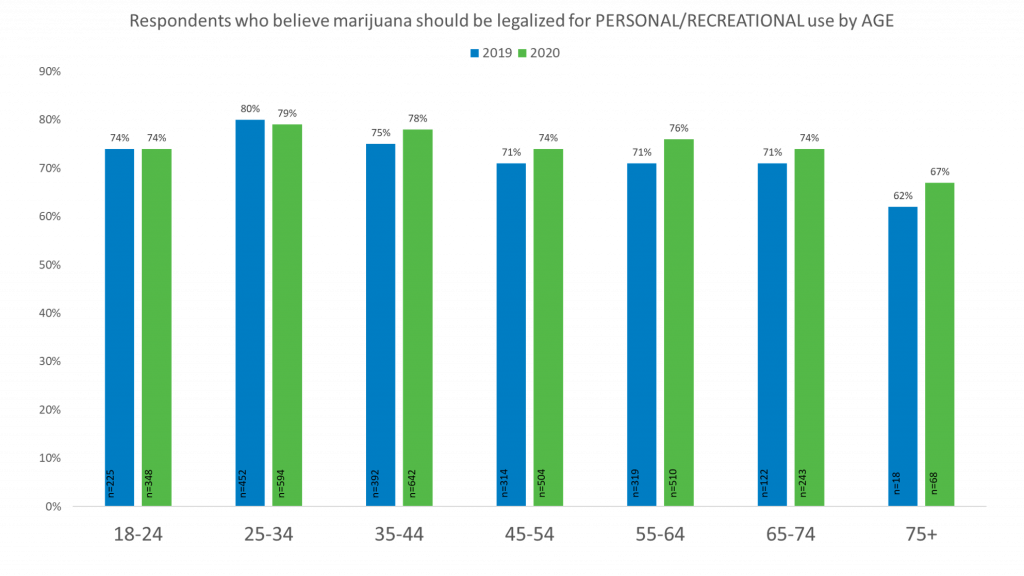
The 25-34 age group was the most likely, at 80%, to be in favor legalizing marijuana for personal/recreational use.
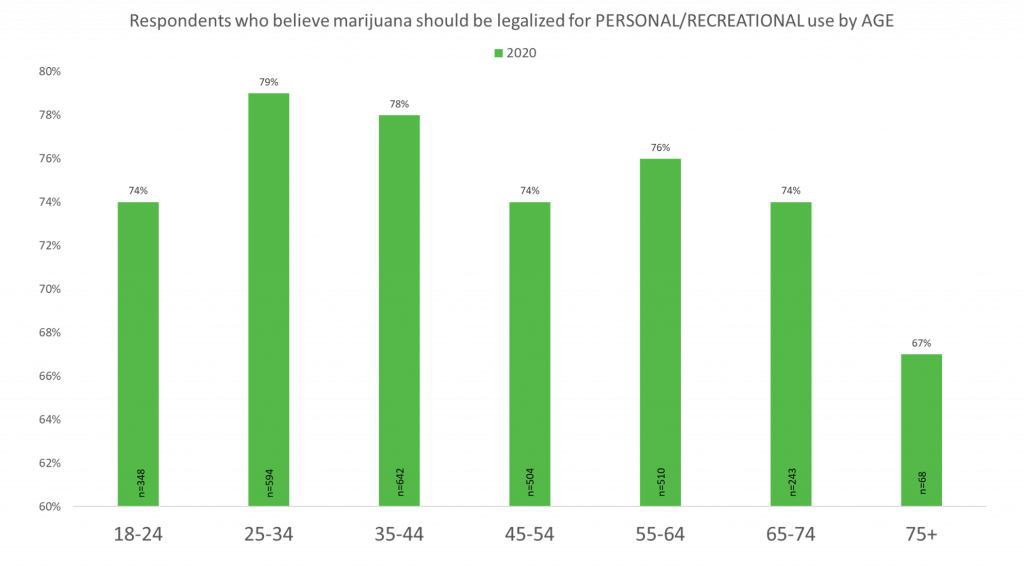
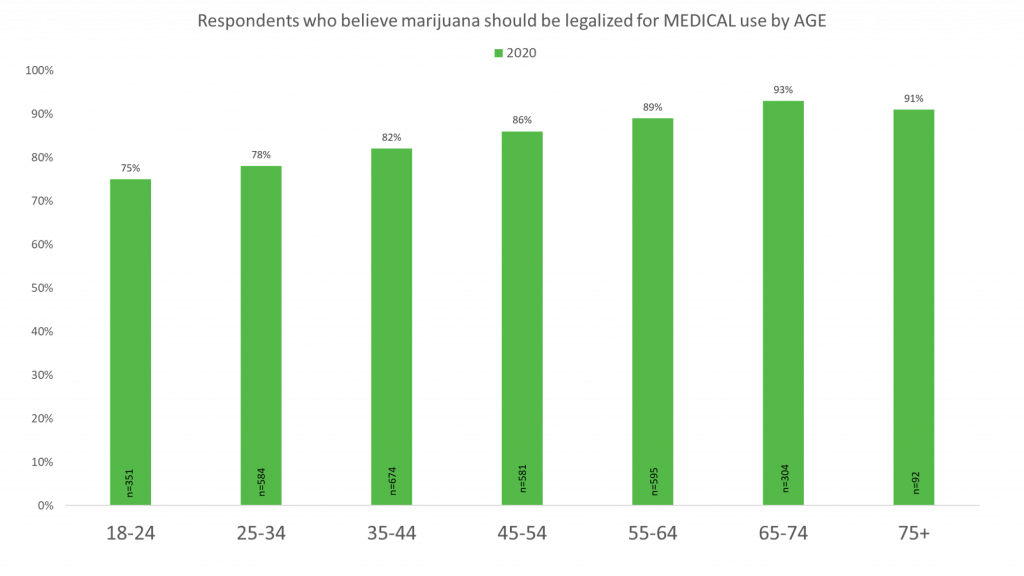
We also found that older respondents were more likely to be in favor of legalizing marijuana for medical use than younger respondents.
Compared to 2019
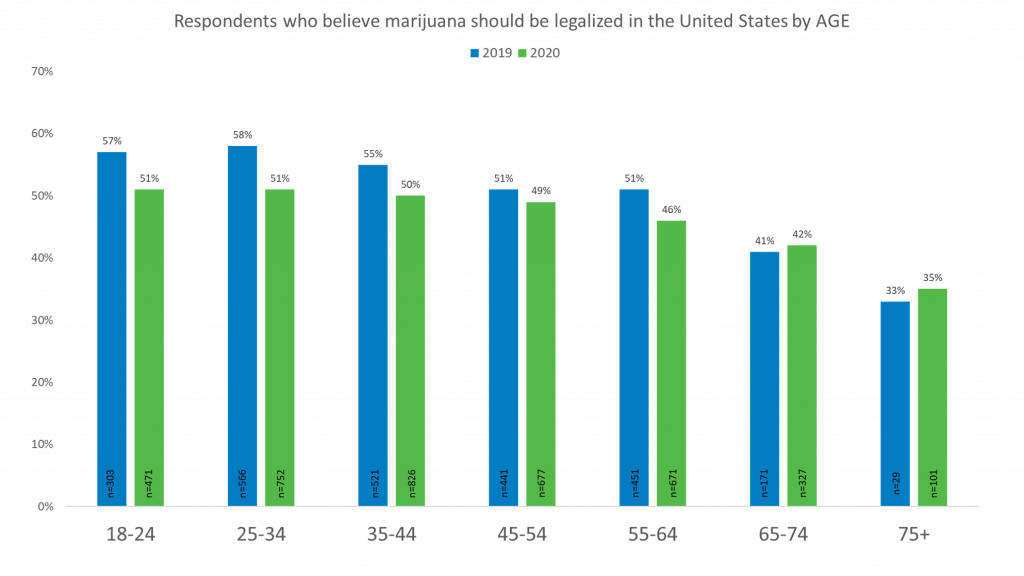
When comparing age year-over-year, we found that all of the age groups saw a decrease in the number of respondents who believe that marijuana should be legalized except for the 65-74 and 75+ age ranges, which saw a 1% and 2% increase, respectively.
Similar to the results by gender, the number of respondents who believe marijuana should be legalized declined in the past year, while those in favor of legalizing marijuana for personal/recreational use increased. The age groups that saw the highest increase from 2019 to 2020 were the 55-64 and 75+ age ranges, which saw a 5% increase.
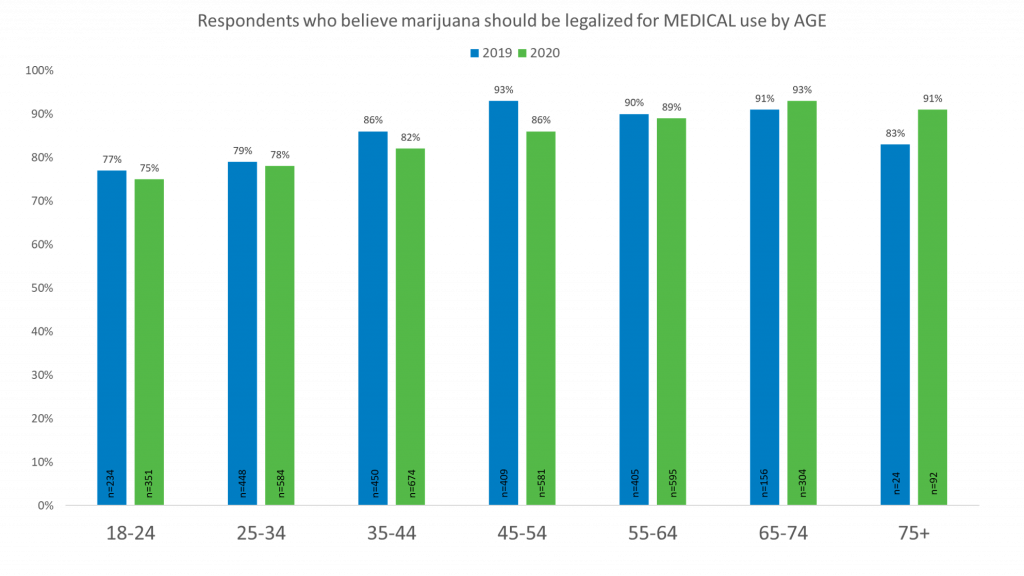
Generally, the number of respondents who believe marijuana should be legalized for medical use decreased in the past year, the biggest decrease being among the 45-54 age group, which saw a 7% decrease. However, the 75+ age group increased in favor of legalizing marijuana for medical use by 8%.
Legalization by Political Party
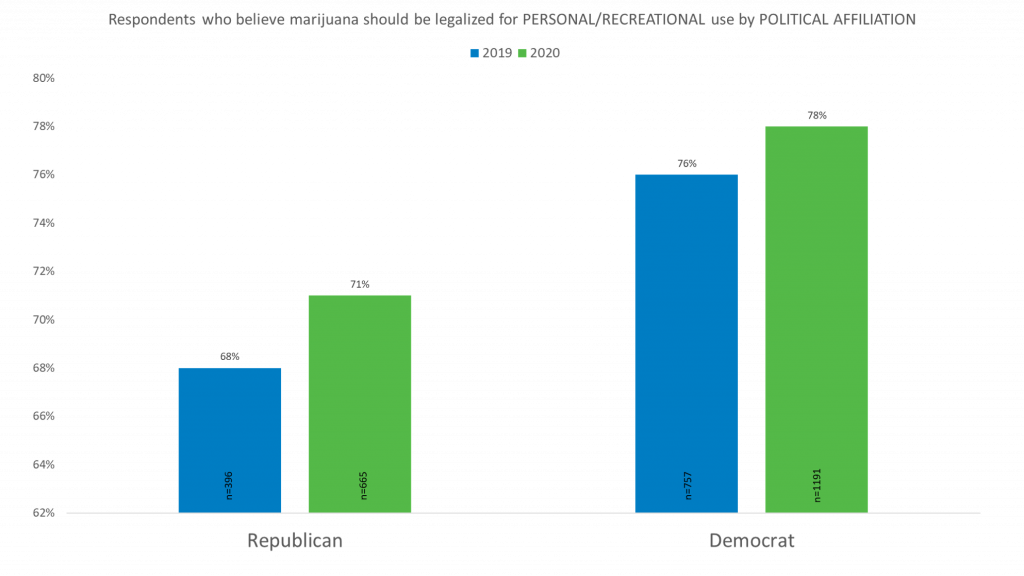
Despite both parties seeing a general decrease in favor of marijuana legalization, it is no surprise that our research found that Democrats are more likely than Republicans to believe that marijuana should be legalized in the United States.
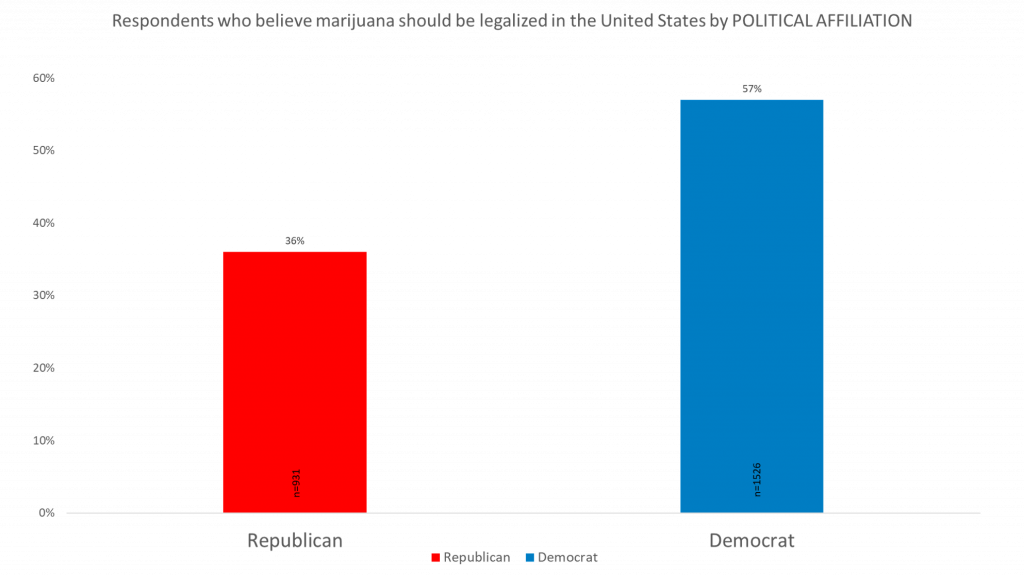
Both Democrats and Republicans saw an increase in the number of respondents who believe that marijuana should be legalized for personal/recreational use.
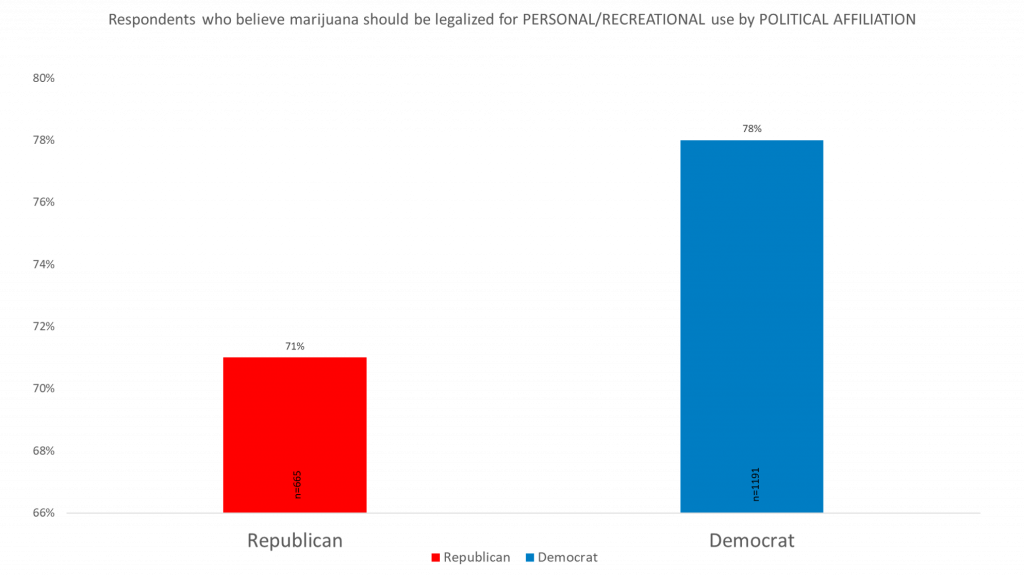
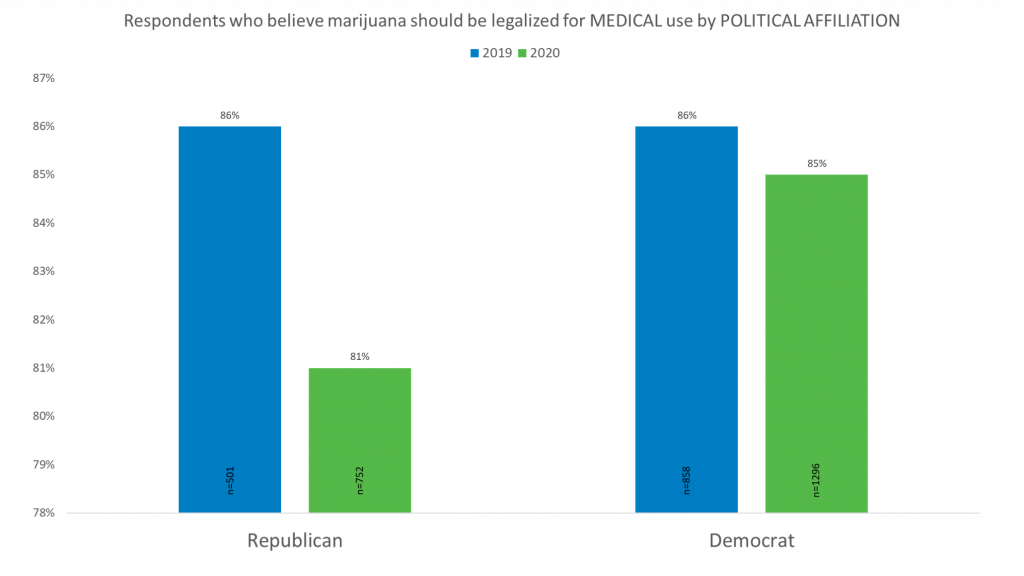
However, when it comes to legalizing marijuana for medical use, both parties saw a decrease in the number of respondents in favor.
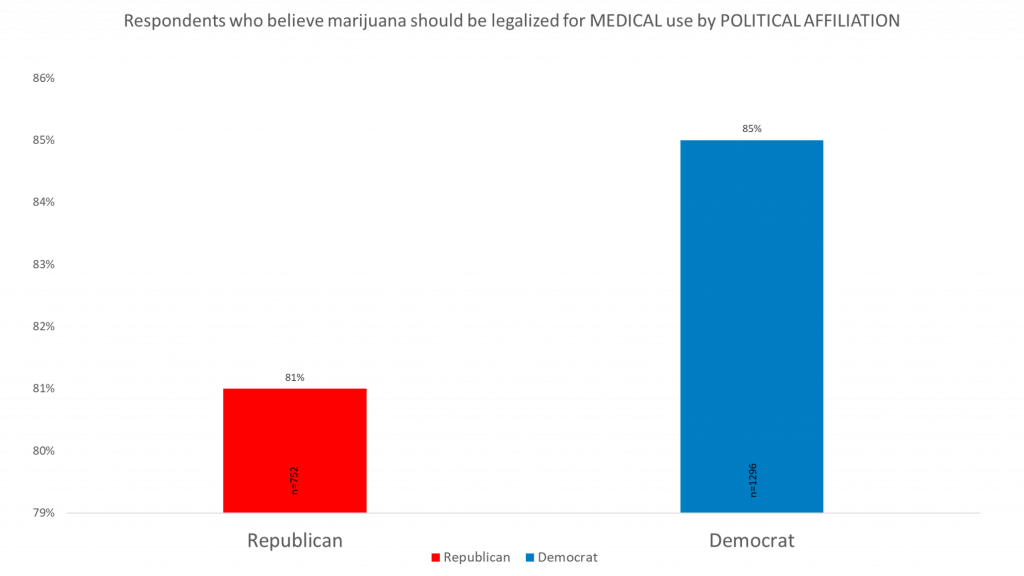
Compared to 2019
In comparison to our 2019 research, we found that Democrats saw a 5% decrease and Republicans saw a 7% decrease in 2020 for the number of respondents who believe that marijuana should be legalized in the United States.
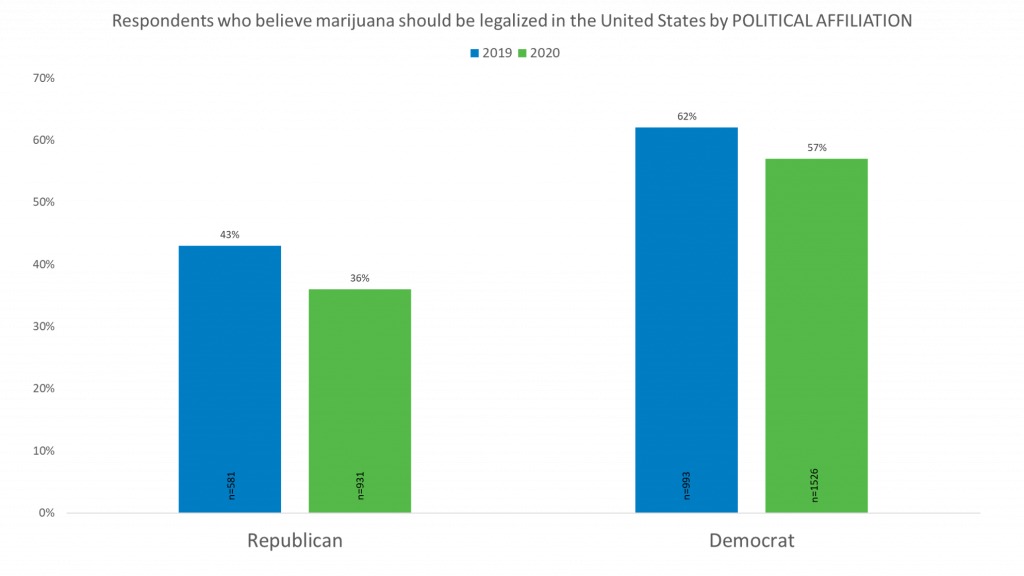
The number of Republican respondents who believe that marijuana should be legalized for personal/recreational use increased by 3% and the number of Democrat respondents in favor increased by 2% since 2019.
Since 2019, the number of Republican respondents who believe that marijuana should be legalized for medical use has decreased by 5% and the number of Democrat respondents in favor decreased by 1%.
Legalization by Panel
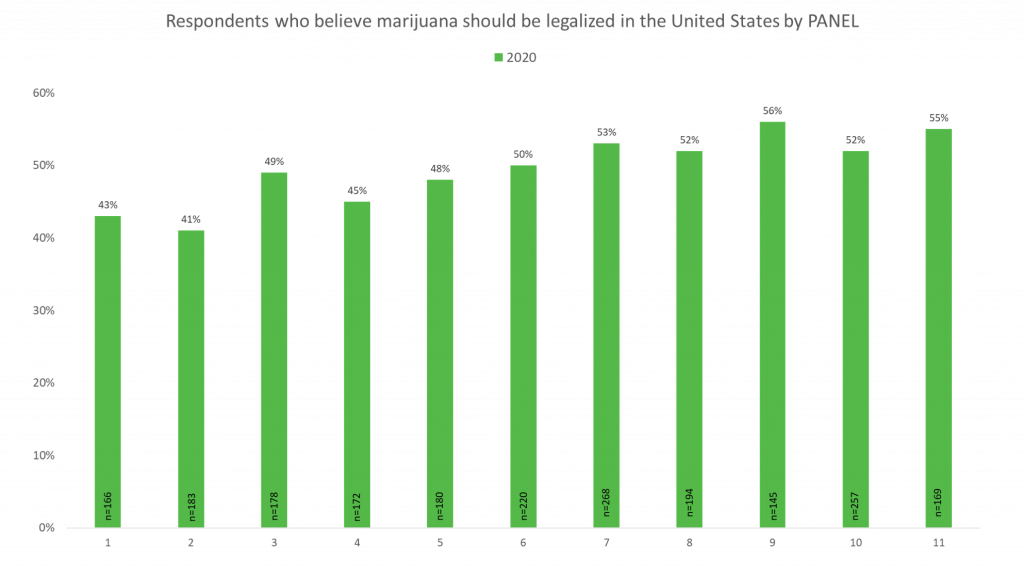
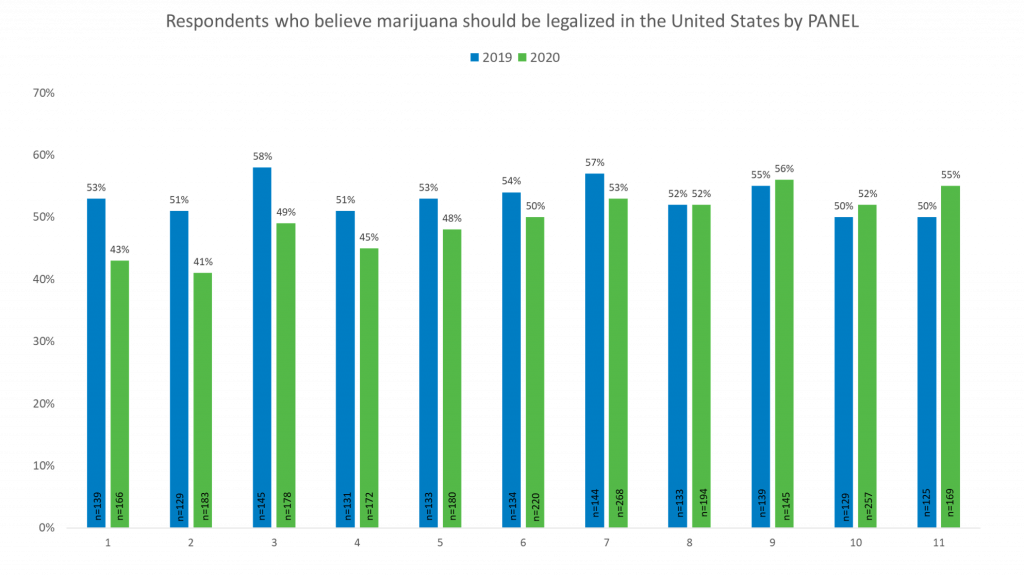
We also segmented the research by panel to look for possible discrepancies. We found that Panels 9 and 11 were more likely to believe that marijuana should be made legal in the United States. Panel 2 was the least likely.
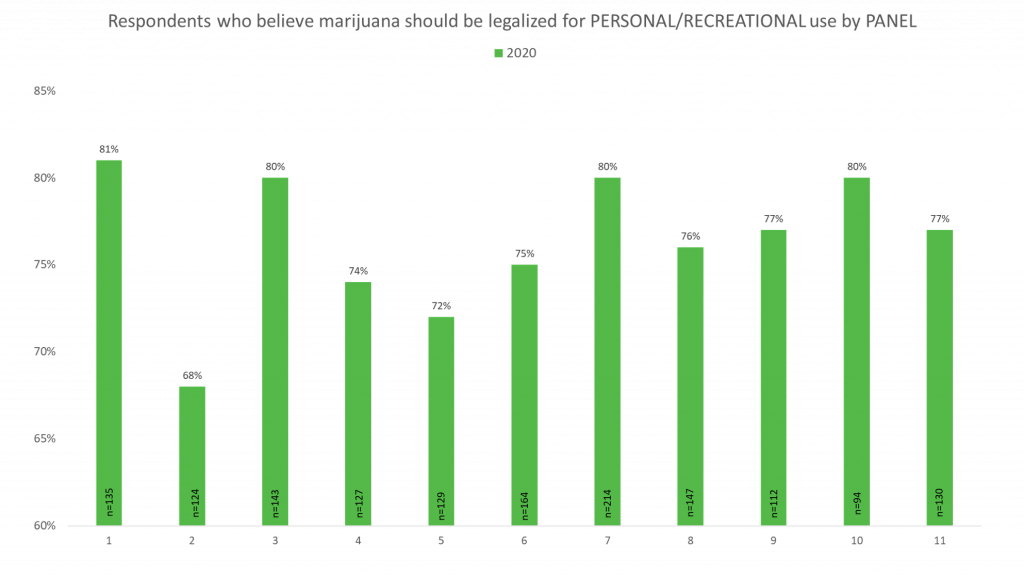
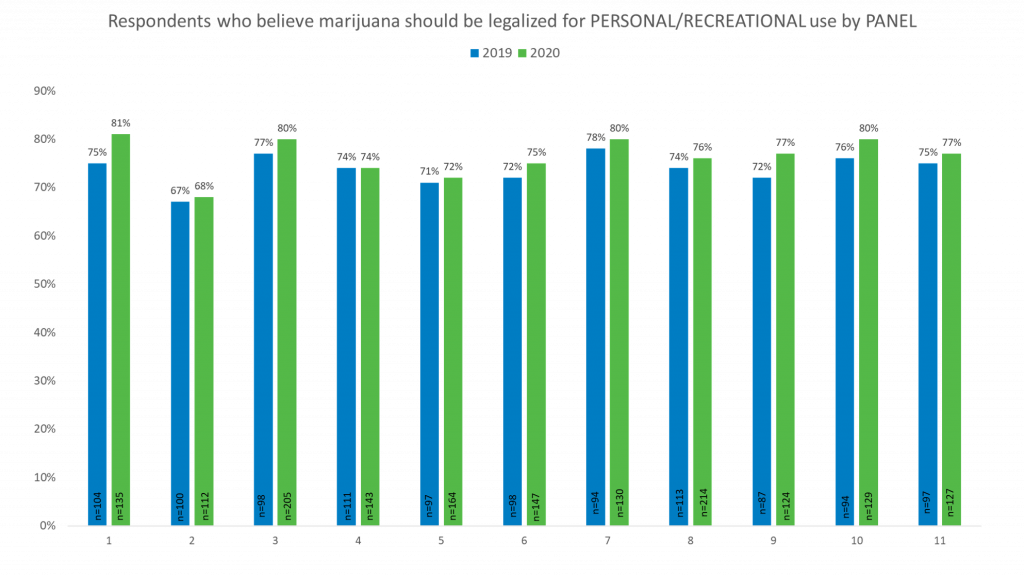
When looking at marijuana legalization for personal/recreational use, we found that Panels 1, 10, 3, and 7 were most in favor with Panel 2 being the least in favor.
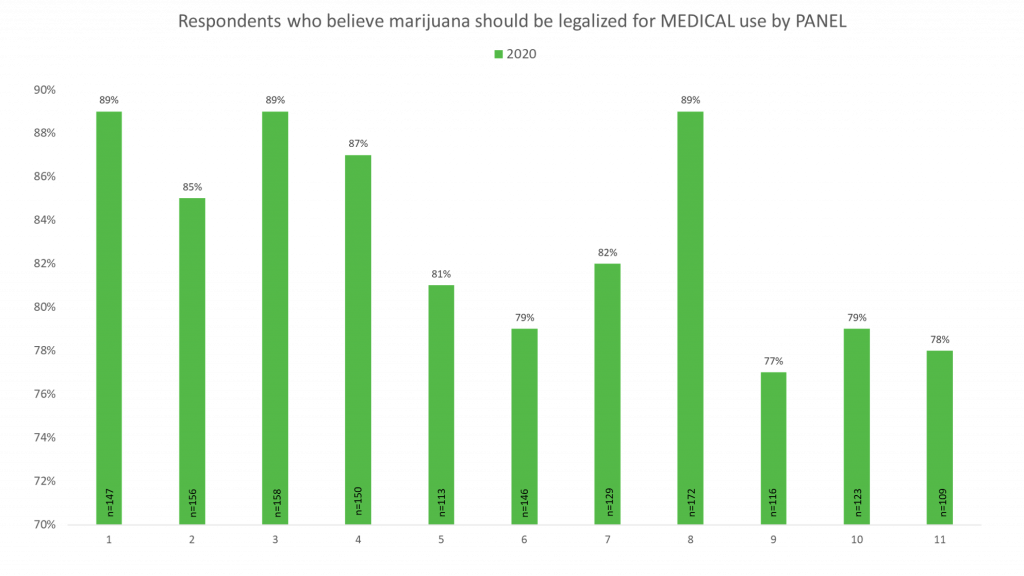
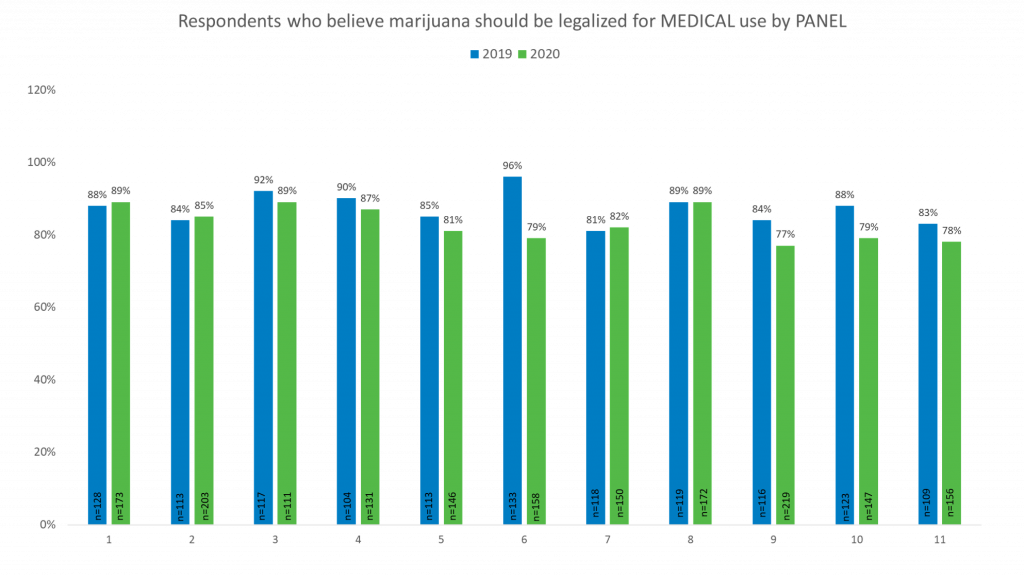
We also found that Panel 6 has the highest number of respondents in favor of marijuana legalization for medical use and Panel 9 is least in favor.
Compared to 2019
When comparing our results by panel year-over-year, we found that our panels generally saw a decrease in respondents who believe marijuana should be legalized in the United States with Panel 1 seeing the largest decrease at 10% and Panel 3 seeing a decrease of 9%.
Since 2019, the number of respondents in favor of marijuana legalization for personal/recreational use has increased by panel. Panel 1 saw the largest increase with 6% and Panel 10 saw an increase of 4%.
The number of respondents in favor of legalizing marijuana for medical use has generally decreased. Panel 6 saw the largest decrease with a 7% decrease. However, Panels 1, 7, and 2 each saw increases of 1%.
Why the Differences?
While there are many reasons why these differences exist among these demographics, the primary reason is that panels are built and managed differently. These differences are neither good nor bad, but they do have an impact on the data you receive. Even with strict balancing on demographics, there can be differences in attitudinal and behavioral responses between panels, just like this.
Because of this, and the importance of panel choice for different business decisions, we recommend a blended approach to sampling. That’s why we use our intentional and controlled method of sample blending, IntelliBlend®.


