
Health Insurance Choices Feel Endless but a Few Names Dominate
February 18, 2026
Defender Gets Backup: Inside the ReDem Acquisition with Vignesh Krishnan of Rep Data
February 24, 2026
Religious identity is one of the many aspects that is used to shape people’s overall identity. It helps people understand themselves and their place within their communities. Since it is such an important aspect to many, we wanted to better understand how people identify their religious affiliation. Let’s find out what we uncovered.
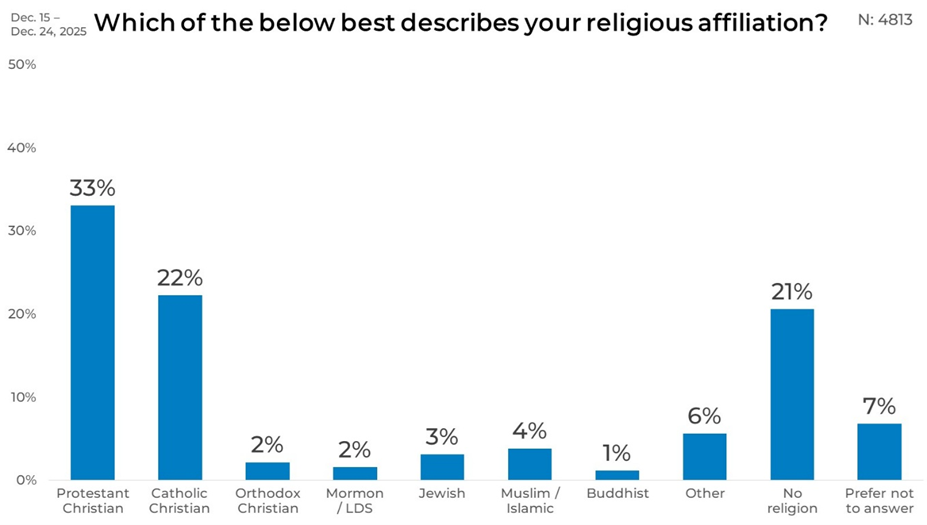
Overall
Overall, Protestant Christian (33%), Catholic Christian (22%), and No religion / Atheist / Agnostic (21%) are the top three affiliations people identified. Together, these three account for more than three-quarters of responses, while every other affiliation remains in the single digits. Muslim / Islamic (4%), Jewish (3%), Orthodox Christian (2%), Mormon / LDS (2%), and Buddhist (1%) represent smaller shares.
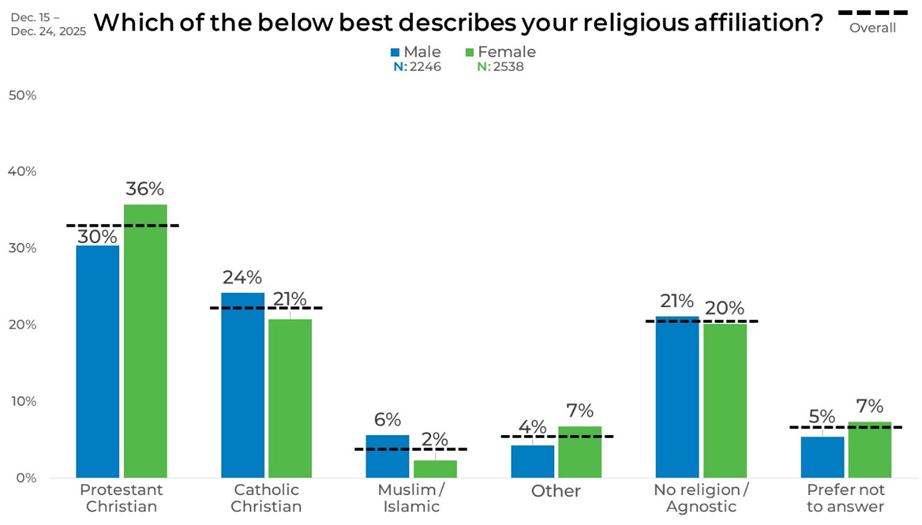
Gender
Gender differences are most visible in Protestant Christian identification, which is higher among women (36%) than men (30%). Catholic Christian affiliation shows a smaller gap, with men at 24% and women at 21%. Muslim / Islamic identification is three times higher among men (6%) than among women (2%).
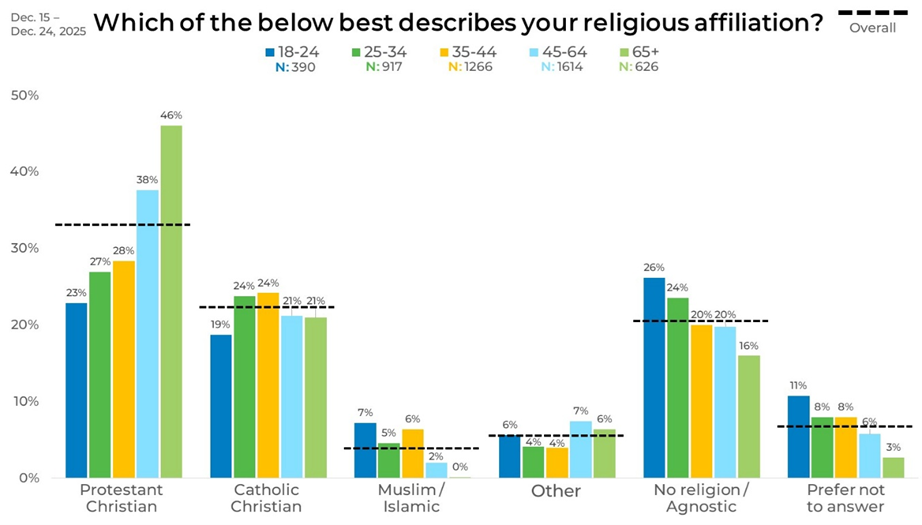
Age
Age reveals a steady increase in Protestant Christian identification, rising from 23% among ages 18–24 to 46% among those 65 and older. In contrast, No religion / Atheist / Agnostic declines with age, from 26% among the youngest group to 16% among seniors. Catholic Christian affiliation remains comparatively stable across age groups, generally between 19% and 24%. Muslim / Islamic identification is concentrated among younger respondents, reaching 7% among ages 18–24 and falling to 0% among those 65+.
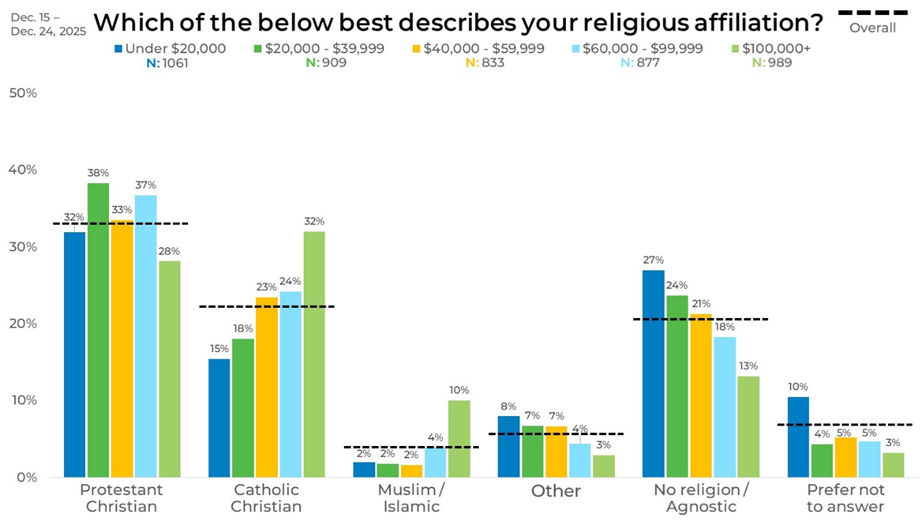
Income
Income differences show Protestant Christian identification peaking among those earning $20,000–$39,999 (38%) and declining to 28% among those earning $100,000+. Catholic Christian affiliation moves in the opposite direction, increasing steadily from 15% among those earning under $20,000 to 32% among those earning $100,000+.
No religion / Atheist / Agnostic declines as income rises, from 27% in the lowest income group to 13% in the highest. Muslim/Islamic identification remains at 2% among those earning below $60,000, but increases to 4% among those earning $60,000–$99,999 and 10% among those earning $100,000+.
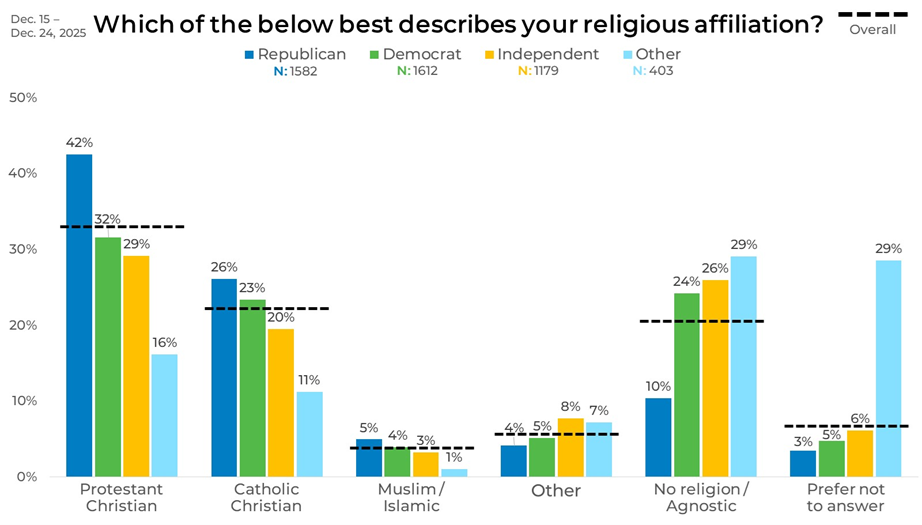
Political Affiliation
Political affiliation shows some of the clearest contrasts. Protestant Christian identification is highest among Republicans at 42%, compared with 32% of Democrats, 29% of Independents. Catholic Christian affiliation follows a similar pattern, highest among Republicans (26%).
In contrast, No religion / Atheist / Agnostic is lowest among Republicans at 10% and rises to 24% among Democrats, 26% among Independents, and 29% among the Other political group.
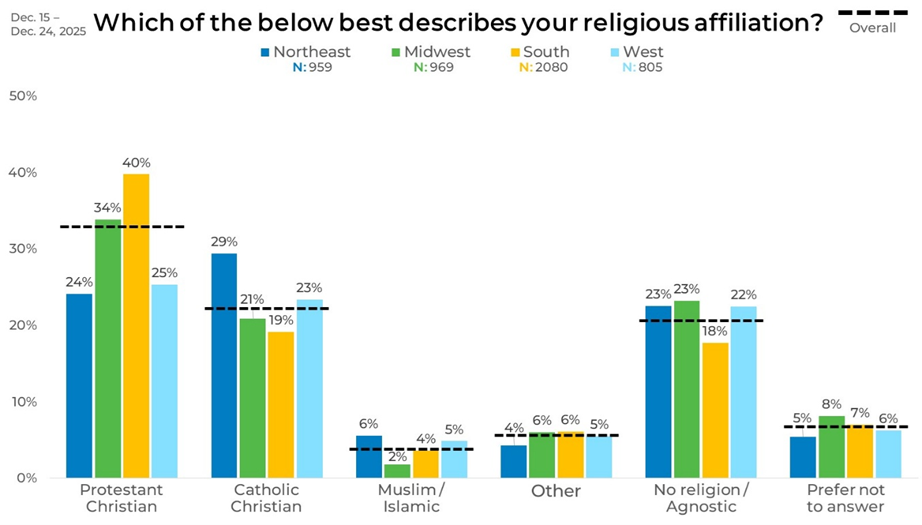
Region
Regional patterns show Protestant Christian identification concentrated in the South at 40%, compared with 34% in the Midwest and roughly one-quarter in the West (25%) and Northeast (24%). Catholic Christian affiliation is strongest in the Northeast at 29%, noticeably higher than in the South (19%), Midwest (21%), or West (23%). No religion / Atheist / Agnostic responses are relatively consistent across regions, clustering between 18% and 23%, though slightly lower in the South (18%).
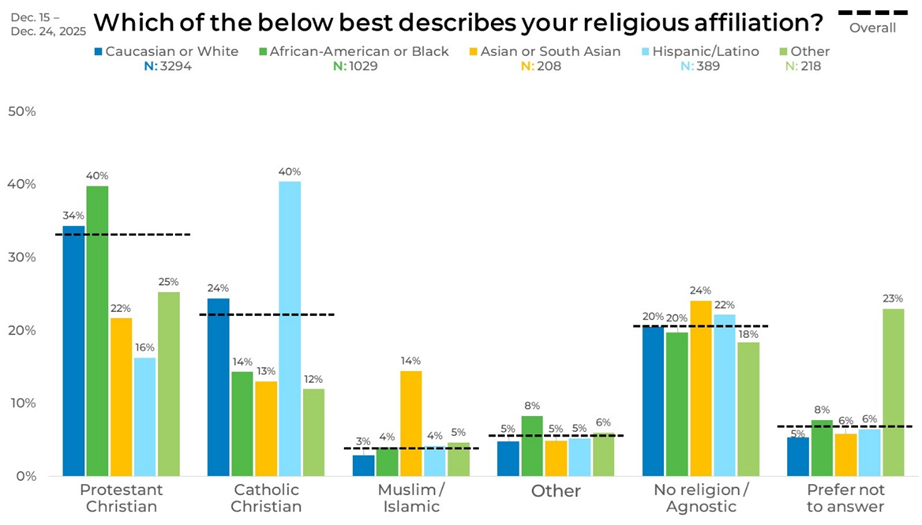
Ethnicity
Protestant Christian identification is highest among African American respondents at 40%, followed by Caucasian respondents at 34%. It is lower among Asian or South Asian (22%) and Hispanic/Latino respondents (16%). Catholic Christian affiliation stands out among Hispanic/Latino respondents at 40%, compared with 24% of Caucasian respondents and 14% of African American respondents.
Muslim / Islamic identification is most prominent among Asian or South Asian respondents at 14%, well above the 3% to 5% range observed in other racial and ethnic groups. No religion / Atheist / Agnostic responses range from 18% to 24% across groups.
Panel
Splitting the data by panel source uncovered wide variations of religious affiliation among its panelists. Protestant Christian identification ranges from 32% in Panels G and N to 41% in Panel D, while Catholic Christian affiliation spans from 17% in Panel D to 26% in Panel V.
No religion / Atheist / Agnostic reaches its highest level in Panel J at 31% and its lowest in Panel V at 10%. Muslim / Islamic identification varies from 1% in Panel D to 10% in Panel V. Prefer not to answer ranges from 2% in Panel J to 10% in Panel G.
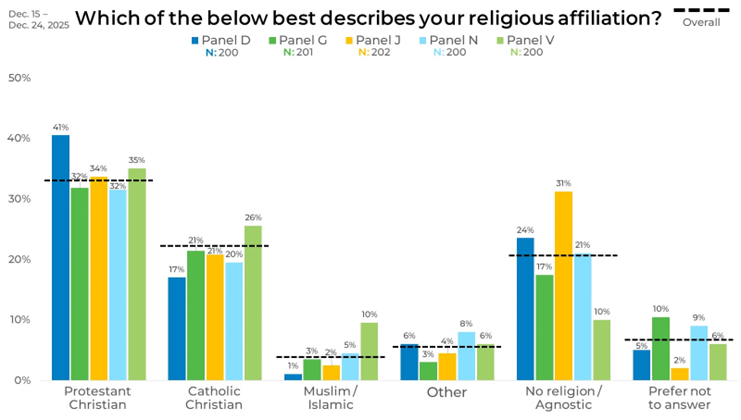
Considering these differences together truly highlights how strategically blending panels is the best practice to ensure you get accurate insights. Click the button below to find out how EMI can help.

