
Efficiency or Deficit: How Americans Feel About DOGE’s Budget Cuts
July 22, 2025
Tariff Tension: Americans’ Concern Over Changing Policy
July 29, 2025
Tariffs have emerged as the largest platform of the current administration and arguably the most polarizing domestic development of 2025. In the works for months, the U.S. government’s new tariffs have affected prices across the country, directly impacting the livelihood of every American. Our recent round of research-on-research attempts to explore the public’s awareness regarding these new tariffs in addition to mapping a level of support for them. The first part of our two-part series on tariffs contains those answers below.
Awareness of Tariffs
Overall
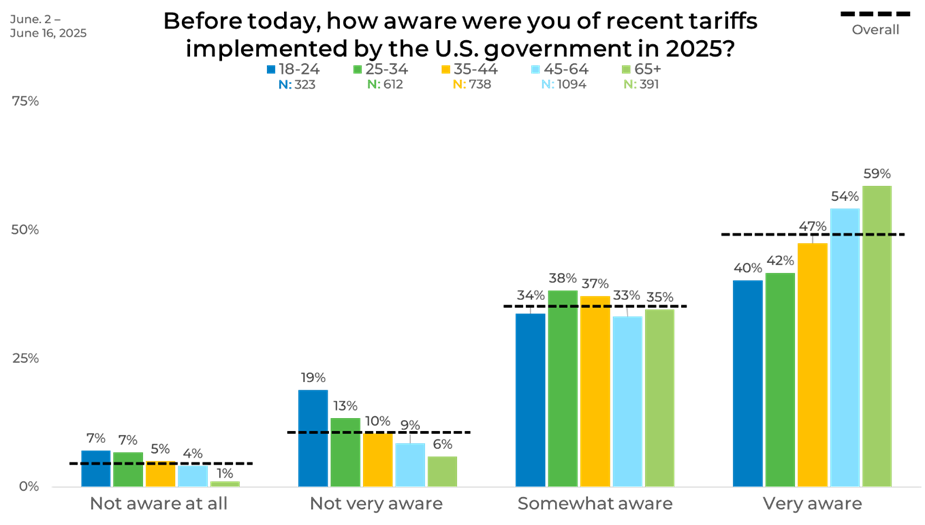
Overall, 84% of respondents indicated at least some awareness of the tariffs. Nearly half (49%) reported being very aware, and 35% were somewhat aware. A smaller portion, 11%, said they were not very aware, and just 5% were not aware at all. This widespread recognition shows the issue’s broad reach and sets the stage for understanding public sentiment and division.

Age
Awareness of the tariffs increased noticeably with age, but younger groups were not completely disengaged. Among 18–24-year-olds, while only 40% were very aware, an additional 34% were somewhat aware—leaving over a quarter less informed. The 25–34 age group performed slightly better, with 42% very aware and a smaller 20% in the lower-awareness categories.
The most marked gains came among those aged 35 and above. For 35–44-year-olds, nearly half were very aware and only 15% had low awareness. In the 45–64 group, over half (54%) were very aware, and this rose to 59% for those 65 and older, where just 7% were not informed. As age increased, the likelihood of strong awareness became more pronounced, showing a steady climb in information exposure.
Income
Tariff awareness climbed steadily with income level, highlighting a clear information gap across economic groups. Those earning under $20,000 were the least informed, with 28% showing low awareness and only 38% being very aware. As income rose, low awareness fell while strong awareness rose.
Respondents earning between $20,000 and $59,999 saw a boost in awareness, with 42% to 47% reporting they were very aware. The trend became more pronounced at higher income levels: 55% of those in the $60,000–$99,999 bracket and 64% of those earning $100,000 or more were very aware. At the top end, only 6% had limited awareness, making them the most informed group overall.

Support of Tariffs
Overall
Only respondents who indicated they were at least somewhat aware of the tariffs, comprising 84% of the total sample, were asked about their level of support or opposition. Among these, 30% strongly opposed the tariffs and 13% somewhat opposed. Neutral views accounted for 18%, while 20% somewhat supported and another 18% strongly supported the policy.

Gender
Support and opposition varied between men and women. Among men, 39% were in the bottom 2 box (opposing) and 46% in the top 2 box (supporting), with 16% neutral. For women, 48% were opposed, 31% supported the tariffs, and 21% were neutral. This shows men leaned slightly toward support, while women were more skeptical with higher opposition.

Age
Trends in support and opposition showed a U-shaped curve across age groups. The youngest group (18–24) had 44% in the bottom 2 box (opposing), just 30% in the top 2 box (supporting), and the highest neutral rate at 26%. Those aged 25–34 and 35–44 showed increased support, reaching 39% and 44% respectively, while opposition declined to 37% and 39%.
Older adults shifted back toward stronger opposition. In the 45–64 and 65+ brackets, opposition rose again to 48% for both groups, while support dropped slightly to 35% and 38%. These trends highlight a generational divide, with middle-aged adults showing the most support and both younger and older adults leaning more skeptical.

Income
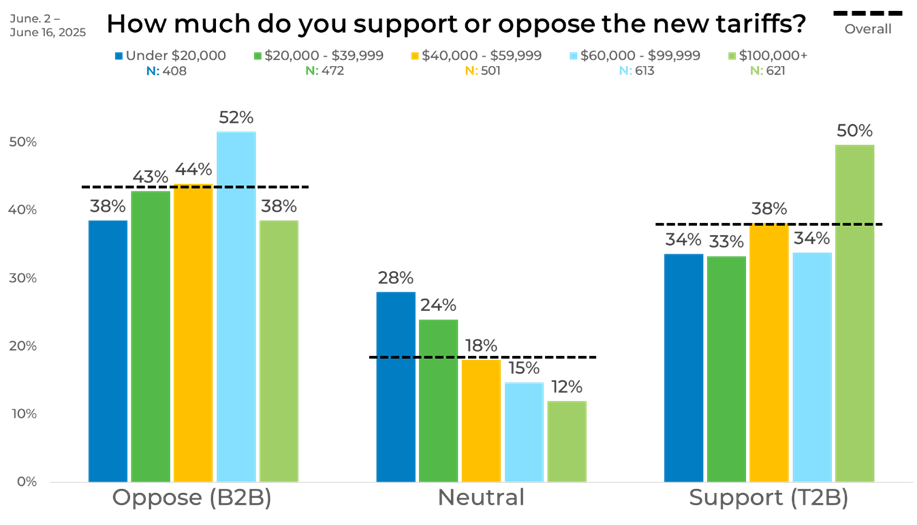
Support and opposition varied significantly across income levels. The highest-income group ($100,000+) showed the strongest support at 50%, with only 38% opposed and the lowest neutrality rate at 12%. In contrast, the $60,000–$99,999 group leaned more oppositional, with 52% in the bottom 2 box and just 34% supporting.
Middle-income respondents in the $40,000–$59,999 range were more evenly split, with 44% opposing and 38% supporting. Lower-income groups—under $20,000 and $20,000–$39,999—tended to be more neutral at 28% and 24% respectively, with support ranging from 33% to 34% and opposition rising to 38%–43%. These patterns show that while strong support peaks at the highest income level, opposition intensifies in the upper-middle range.
Political Affiliation
Political identity played a significant role. Republicans showed the highest level of support, with 66% in the top 2 box and only 13% opposing the tariffs. Democrats were the most opposed, with 71% in the bottom 2 box and just 18% in support. Independents were more divided, with 49% opposing and 28% supporting, while 23% remained neutral. Those identifying with other parties were evenly split between 50% opposition and 17% support, with a notable 33% neutral.

Region
Across regions, support and opposition remained relatively close, but some distinctions emerged. The Northeast and West each showed 44% opposition, while the Midwest registered the highest at 48%. The South had the lowest opposition at 41%. On the support side, the South and Northeast both reached 39%, followed by the West at 36%, with the Midwest slightly lower at 35%. Neutral views ranged narrowly from 17% to 20% across all regions. While no region showed overwhelming consensus, the Midwest leaned more oppositional, whereas the South and Northeast showed comparatively stronger support.

Ethnicity
Ethnic breakdowns showed notable variation. Asian or South Asian respondents had the highest opposition at 51%, with only 33% in support. African Americans also leaned more oppositional at 47% B2B, with 33% support. Caucasians were similarly split with 43% opposition and 39% support. Hispanic/Latino respondents stood out with 43% in support and 37% opposing, the only group where support exceeded opposition. The “Other” category showed 48% opposition and 31% support, further illustrating how attitudes toward the tariffs differ by ethnic group.

Panel
Support and opposition varied sharply across panels, painting very different pictures depending on the source. Panel A showed the most opposition at 53% and the lowest support at 29%, a 24-point swing that reflects a strong lean against the tariffs. On the other end of the spectrum, Panel L reported the highest support at 51% and the lowest opposition at 36%. Panel D leaned more neutral with 26% selecting that option, while Panels F and P stayed relatively balanced, with both support and opposition in the low-to-mid 40s. The biggest contrast between Panel A and Panel L shows why strategic blending sample results gives a fuller, more reliable view than depending on just one.

To find out how EMI’s strategic sample blending can help you on your next project, click on the button below.


