
Zero Gravity, Mixed Reviews: What Americans Think of Celebs in Space
July 15, 2025
Tariff Nation: What Americans Know and How They Feel
July 29, 2025
Earlier this year, the Department of Government Efficiency (DOGE) introduced federal spending cuts to help reduce the national deficit. Reactions to these cuts are mixed, reflecting a broad range of public opinion. For clearer comparisons, demographic graphs use a simplified scale by combining ‘strongly’ and ‘somewhat’ responses into top-two-box (T2B) and bottom-two-box (B2B) categories, helping highlight broader patterns across groups and research panels.
Overall
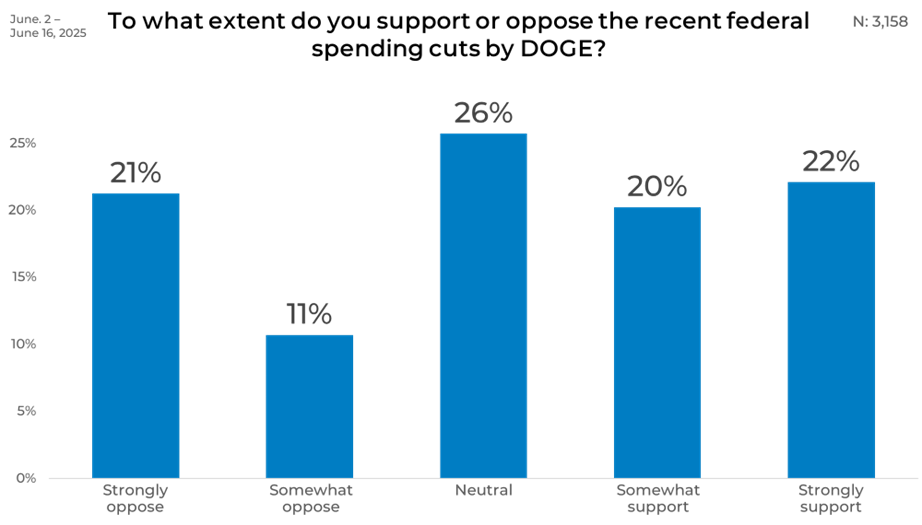
Across the board, the public appears split on the issue. Support and opposition are nearly equal when all five response levels are considered individually: 21% strongly oppose, 11% somewhat oppose, 26% are neutral, 20% somewhat support, and 22% strongly support. This full-scale view underscores the polarized opinions around federal budget decisions tied to deficit reduction.
Gender
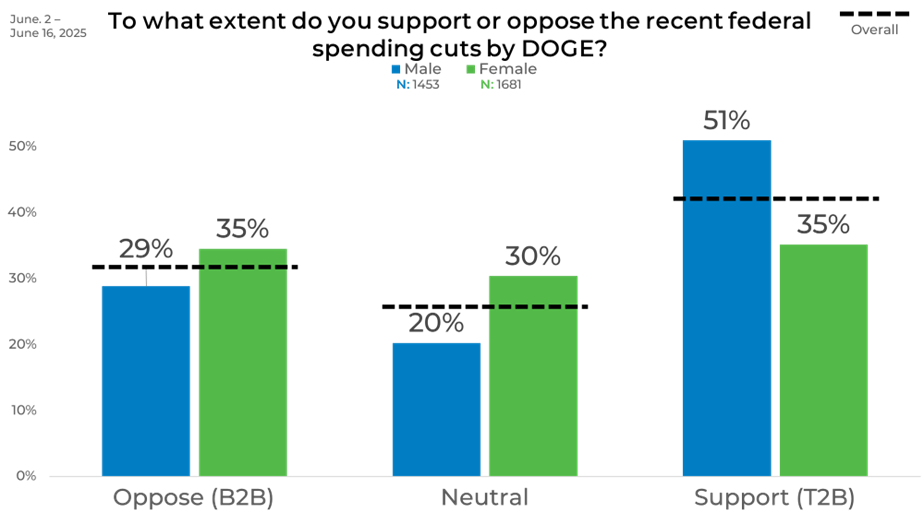
Gender differences reveal that males are more likely to support the cuts, with 51% indicating top-two-box (T2B) support compared to 35% of females. Females are more evenly spread between the two poles and are more likely to oppose or support (both B2B and T2B at 35%) the cuts than be neutral (30%).
Age
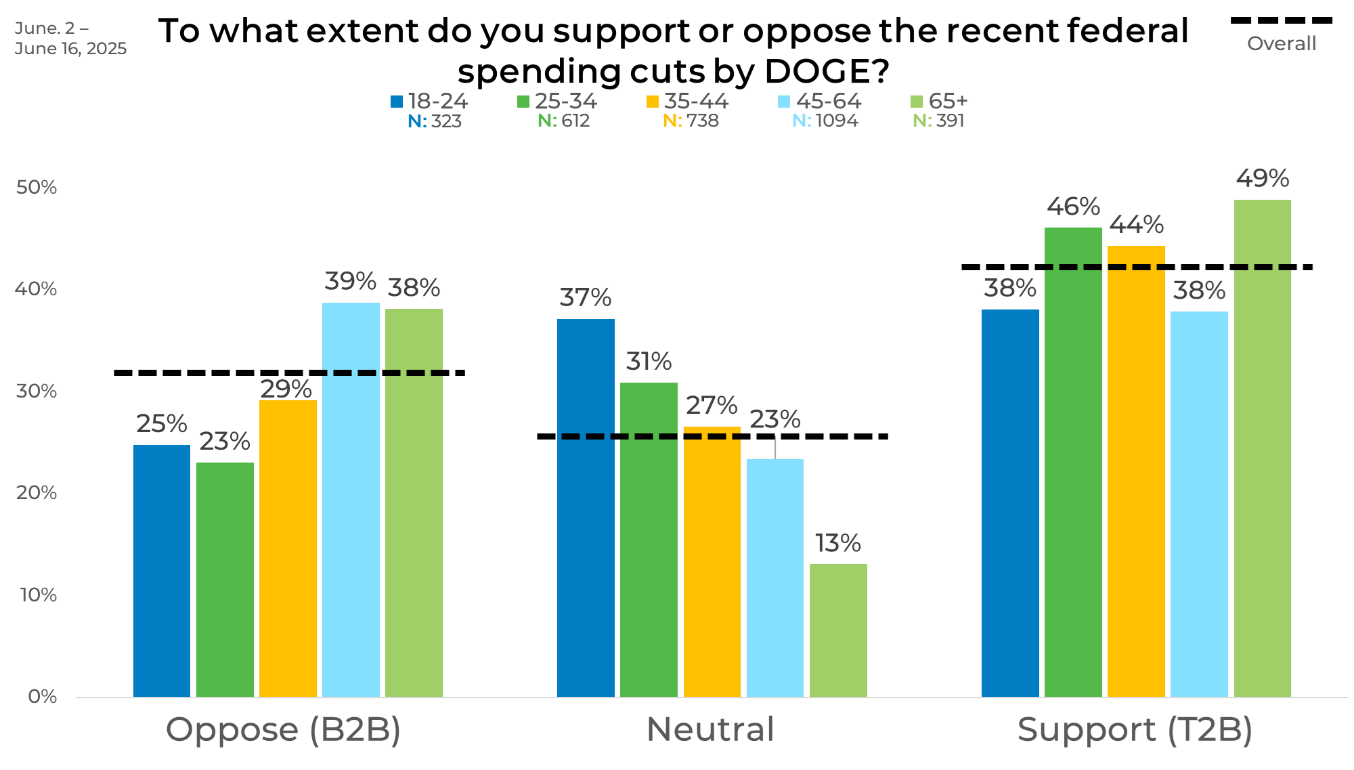
Younger adults aged 18-24 are more likely to remain neutral (37%) and less likely to strongly support or oppose the cuts. As age increases, so does polarization. Those 45 and older are more decisive, with both B2B and T2B percentages rising notably. Support peaks among the 65+ group, where nearly half (49%) back the cuts, suggesting older adults may prioritize deficit reduction more strongly.
Income
Income levels also reflect differing attitudes. Respondents earning $100,000 or more show the highest support at 57% T2B, with just 28% in the B2B category. In contrast, those earning under $20,000 are less supportive, with 30% B2B and only 34% T2B. Neutrality is more common among lower-income respondents, suggesting financial strain may influence uncertainty or opposition.

Political Affiliation
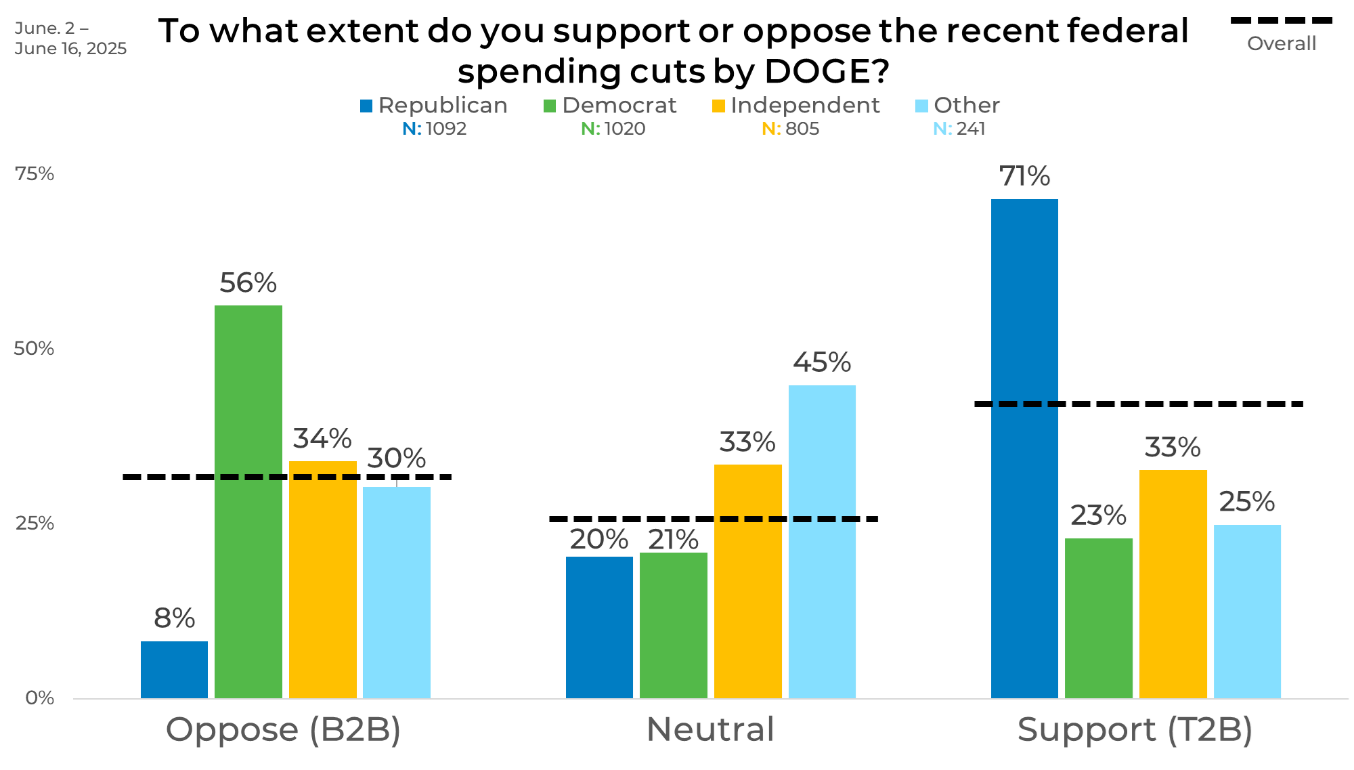
When analyzed by political affiliation, sharp differences emerge. Republicans show strong support for the cuts, with 71% in the T2B category and just 8% in B2B, reflecting widespread approval. In stark contrast, only 23% of Democrats support the cuts, while a significant 56% oppose them. Independents remain nearly equal across the spectrum of opinion, with only a one percentage difference between B2B opposition and Neutral and T2B perspectives. Those identifying with other political affiliations lean even more heavily toward neutrality, with 45% taking a neutral stance and lower levels of both support (25% T2B) and opposition (30% B2B).
Region
Regionally, support levels are relatively consistent, with the South showing the highest T2B support at 45%. The Midwest shows slightly less enthusiasm (38% T2B), while the Northeast and West sit at 42%. Opposition, measured through B2B, ranges narrowly from 29% to 36% across all regions. Overall, regional influence appears modest in shaping opinions.

Ethnicity
Among ethnic groups, levels of support and opposition remain generally close. Caucasian and African-American respondents show similar B2B rates (33% and 32%, respectively), while Hispanics and Asians are slightly less opposed. Support levels (T2B) hover between 35% and 43% across ethnic groups, with Caucasian and Hispanic respondents showing the highest levels of support at 43%

Panel
Panel data reveals notable differences in opinion. Panel Q shows the highest level of support, with 50% in the T2B category and the lowest opposition at 21% B2B. Conversely, Panel A displays the most opposition, with 44% B2B and only 33% in support. Panels C, K, and O fall between these extremes, with T2B support ranging from 37% to 44%.

These disparities illustrate how responses can shift significantly depending on the panel surveyed, reinforcing the value of panel blending to present a more balanced and comprehensive view of public sentiment.


