
The Full-Service Advantage for Research Teams (Outsourcing is the New Insourcing)
November 12, 2025
Thirsty America: What Consumers Are Buying from the Beverage Fridge
November 21, 2025
The state of the economy is once again the leading concern for many Americans. From the performance of the stock market to the affordability of goods and services, Americans are judging the performance based on the impacts they are feeling in their own lives.
We have been tracking sentiment around the current state of the economy for several years, and are looking not only at the current perceptions, but how they have changed over time.
Let’s dig into the data.
Overall
A majority of Americans are displeased with the current state of the economy, with 55% falling into the bottom 3 boxes. The strongest feelings come from the extremes. 17% are “extremely displeased,” compared to 11% who are “extremely pleased.”

Year-Over-Year
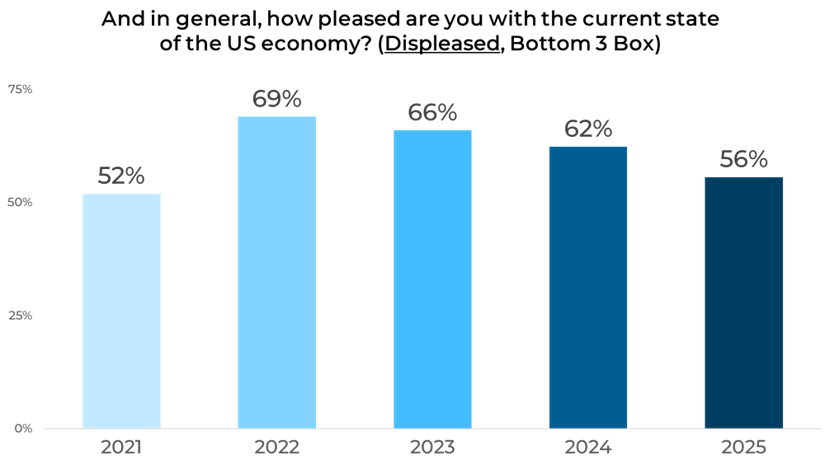
Looking at year-over-year trends, overall displeasure has declined gradually from its 2022 peak. In 2021, 52% of Americans reported being displeased with the economy. That number rose to 69% in 2022, then to 66% in 2023, and to 62% in 2024. The current 2025 figure of 56% marks the lowest level of dissatisfaction since 2022, reflecting a gradual improvement in Americans’ views of the economy.
Gender
Exploring the data by gender unlocks some interesting insights. A majority of men (54%) are pleased with the economy, compared to just 35% of women. Women show significantly higher displeasure at 65%, a sharp contrast in outlooks between genders. This divide shows that men and women differ in their satisfaction with the current state of the economy, underscoring that gender remains an influential factor in shaping public economic sentiment.

Age
Younger adults are split about the state of the economy, while older groups are more skeptical. Those aged 18–to-44 are split nearly evenly between pleased and displeased, while sentiment turns increasingly negative among those 45 and older. The 65+ group reports the most dissatisfaction, with two-thirds (67%) displeased.

Income
Income has a clear relationship with satisfaction. Only 39% of those earning under $20,000 express approval of the economy, compared to 60% among those earning $100,000 or more. Middle-income groups hover near the midpoint, suggesting that financial security strongly aligns with positive economic views.

Political Affiliations
Political affiliation remains one of the most defining factors when discussing the current state of the economy. Republicans are overwhelmingly positive, with two-thirds (66%) expressing satisfaction with the economy. In contrast, only about one-third of Democrats (34%) and Independents (35%) say the same.

Region
Regional patterns are less pronounced but still telling. The South and West report the highest satisfaction levels at 45% and 50%, respectively, while the Midwest shows more economic discontent with 62% displeased. The Northeast falls in the middle, closely aligned with the national average.

Panel
Breaking down the data by panel source shows some clear differences. Panel U reports 74% pleased, while Panel M records 68% displeased—a 42-point gap, the widest difference among panels. Other panels (C, E, and R) remain near the national average, with 42% to 49% pleased.

These results highlight the need to strategically blend your sample to minimize potential bias. Want to learn more about strategic sample blending? Click the button below.

