
2025 In Review: How People Really Rate the Year
January 13, 2026
The 300th Episode
January 28, 2026
2026. A new year. As we dive into the new year, we wanted to understand the outlook people had for this year. In our recent wave of research-on-research, we asked respondents what their outlook was for 2026.
Let’s dive into what people said.
Results are shown using the full five-point scale for the overall sample, while demographic breakouts are summarized using top-two box (T2B: somewhat positive/very positive) and bottom-two box (B2B: somewhat negative/very negative) measures. 3
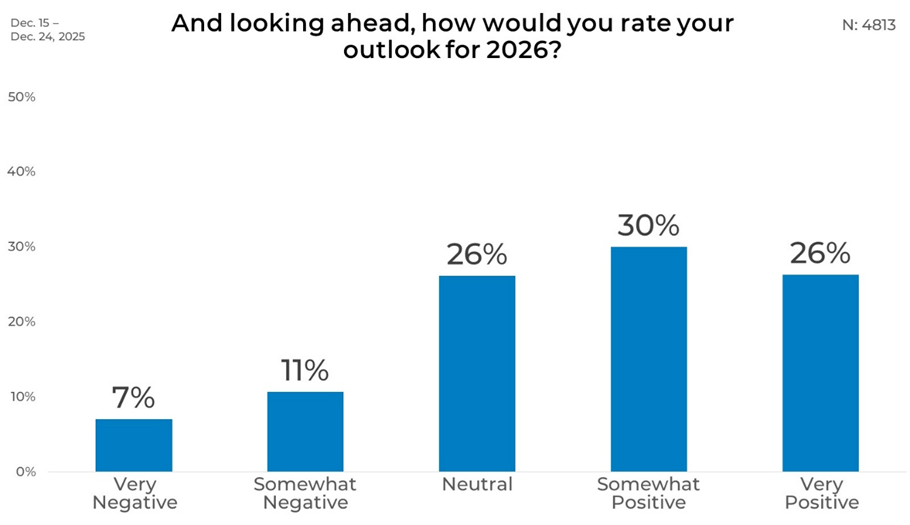
Overall
Overall, a majority of respondents have a positive outlook for 2026. On the negative side, 11% say they feel somewhat negative and 7% very negative about 2026.
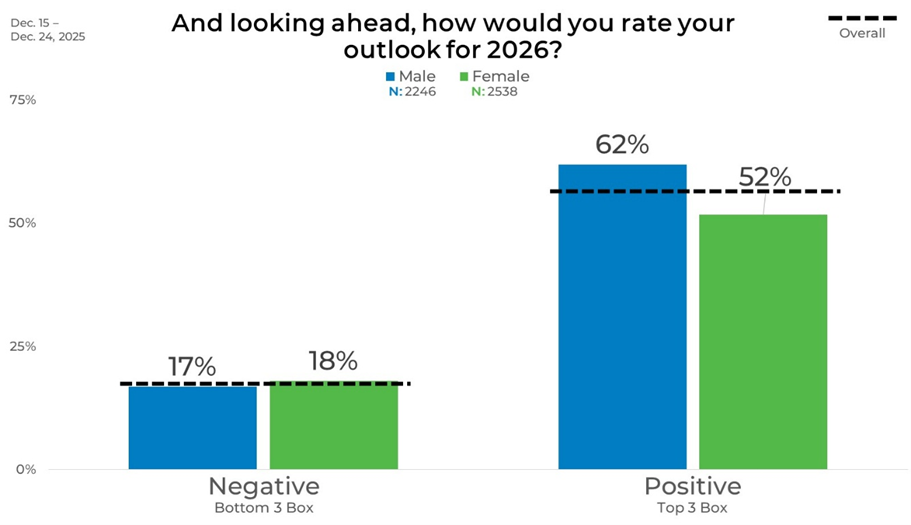
Gender
Breaking down the data by gender highlighted some slight differences. Among men, positive sentiment is more common than negative sentiment, with 62% falling into the top-two box and 17% into the bottom-two box. Women also lean more positive than negative overall, though at lower levels, with 52% in the top-two box and 18% in the bottom-two box. The gap between positive and negative sentiment is wider among men than women.
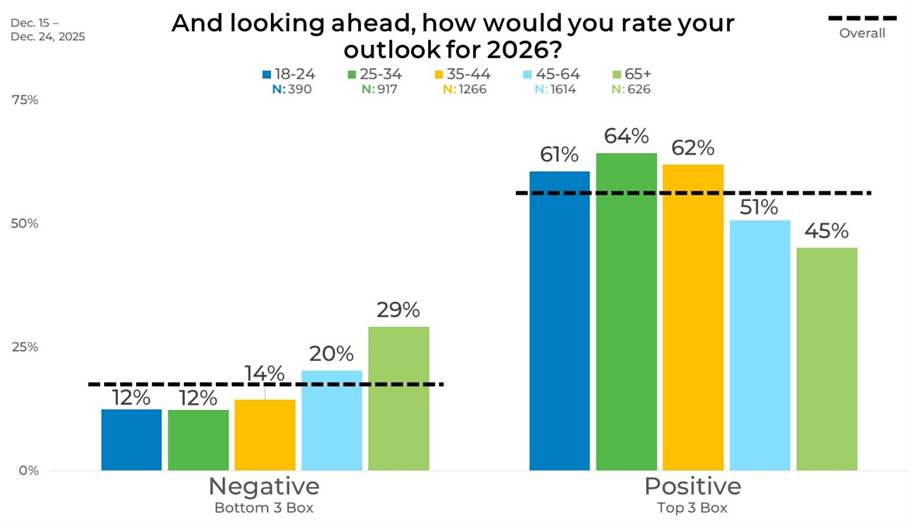
Age
Age differences reveal a gradual shift in outlook. Younger adults tend to be more positive, with top-two box responses at 61% among those ages 18–24, 64% among those 25–34, and 62% among those 35–44. Positivity declines among older groups, falling to 51% for ages 45–64 and 45% for those 65 and older. At the same time, bottom-two box responses increase with age, rising from 12% among the youngest groups to 29% among those 65 and older.
Income
Outlooks of 2026 improve steadily as income levels increase. Among those earning under $20,000, 44% are positive and 20% negative. Positivity increases across each income bracket, reaching 62% among those earning $60,000–$99,999 and 74% among those earning $100,000 or more. Negative sentiment declines as income rises, dropping to 11% in the highest income group.

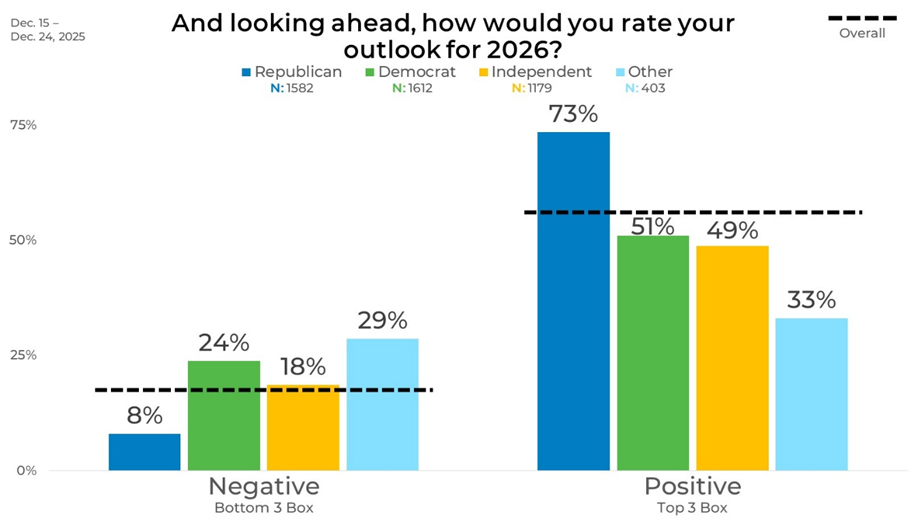
Political Affiliation
Outlooks for 2026 vary noticeably by political affiliation. Republicans show the highest level of positive sentiment, with 73% in the top-two box and just 8% in the bottom-two box. Democrats report a narrower margin, with 51% positive and 24% negative. Independents are split more evenly, with 49% positive and 18% negative.
Ethnicity
Positive outlooks are reported by a majority of racial and ethnic groups. Hispanic or Latino respondents show the highest top-two box score at 62%, followed by African American or Black respondents at 59% and Caucasian or White respondents at 56%. Asian or South Asian respondents report 53% positive sentiment. Bottom-two box responses range from 12% among Hispanic or Latino respondents to 29% among those identifying as Other.

Panel
Panel results show clear differences in people’s outlook for 2026. Panel V reports the highest level of positive outlook, with 72% in the top-two box and 11% in the bottom-two box. Panel R and Panel G also lean strongly positive, at 64% and 58% respectively. Panel A stands out for having the highest share of negative sentiment, with 29% in the bottom-two box and 45% in the top-two box. Panel N falls between these patterns, with 53% positive and 21% negative responses.
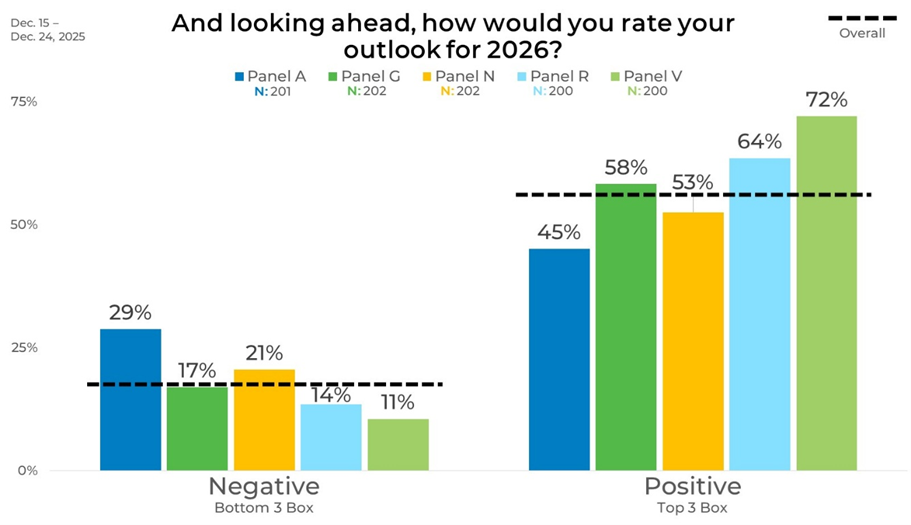
When you look at this data, these contrasts highlight the value of blending panels to capture a wider range of perspectives rather than relying on a single source. Learn how EMI can help by clicking the button below.

