
The Economy’s Winning. Are People? A Look into People’s Financial Sentiment
January 29, 2026
3 Time-Saving Tips for Small Consumer Research Teams
February 4, 2026
No one can predict the future, but there are trends that are happening now that can give clues to how well someone will be doing financially in the near future. In part two of our series on consumer financial sentiment, we asked US consumer if they think they would be better or worse off financially in a year from now.
Let’s dive in.
Overall
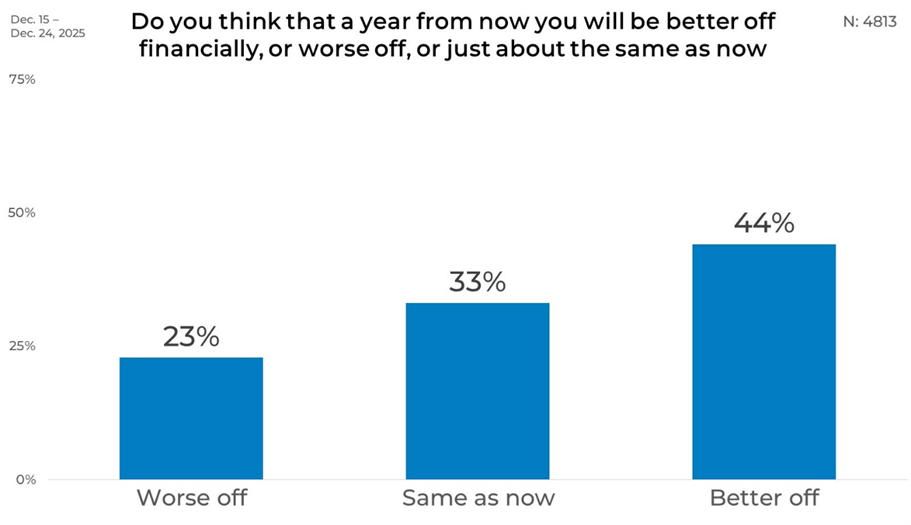
Overall, consumers were optimistic about their financial future, with 44% saying they expect to be better off a year from now. About one-third (33%) believe their situation will be about the same as it is now, while 23% anticipate being worse off.
Gender
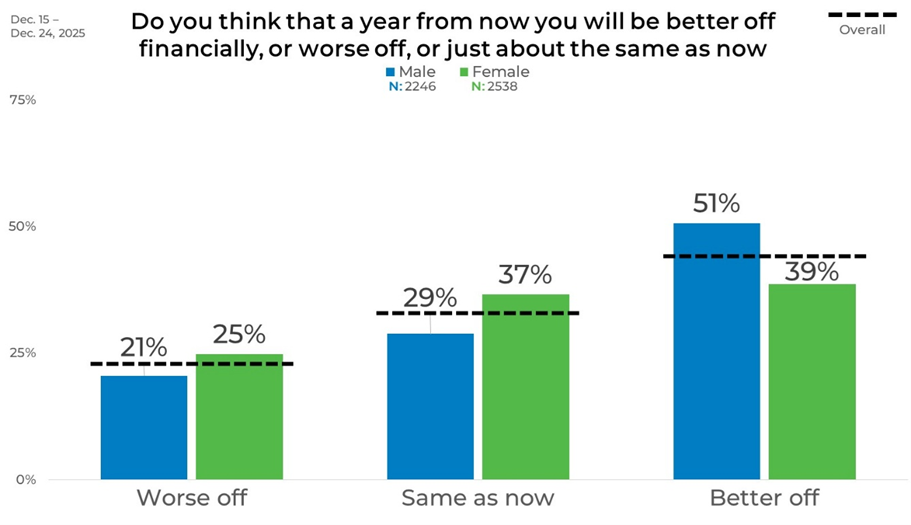
Men are more likely than women to say they expect to be better off financially in a year. Just over half of men (51%) report expecting improvement, compared with 39% of women. Women are more likely to expect their finances to stay about the same, with 37% choosing this option versus 29% of men. Expectations of being worse off are reported by 25% of women and 21% of men.
Age
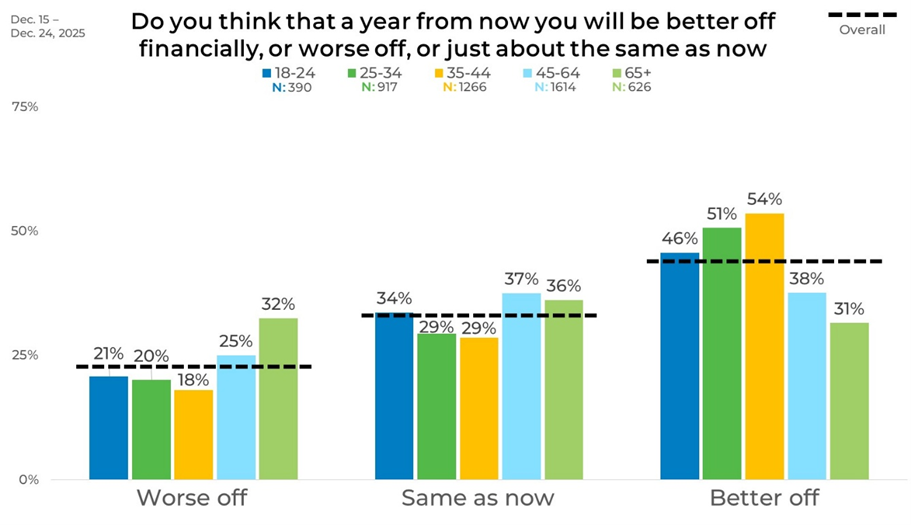
Future financial expectations varied when looking at the data by age. Adults ages 35–44 are the most likely to say they expect to be better off, at 54%, followed by those ages 25–34 at 51%. Younger adults ages 18–24 also lean toward expecting improvement, with 46% saying they will be better off. In contrast, respondents ages 65 and older are less likely to expect improvement, with 31% saying they will be better off and 32% anticipating being worse off. Those ages 45–64 are more evenly split, with 38% expecting improvement and 37% saying they will be about the same.
Income
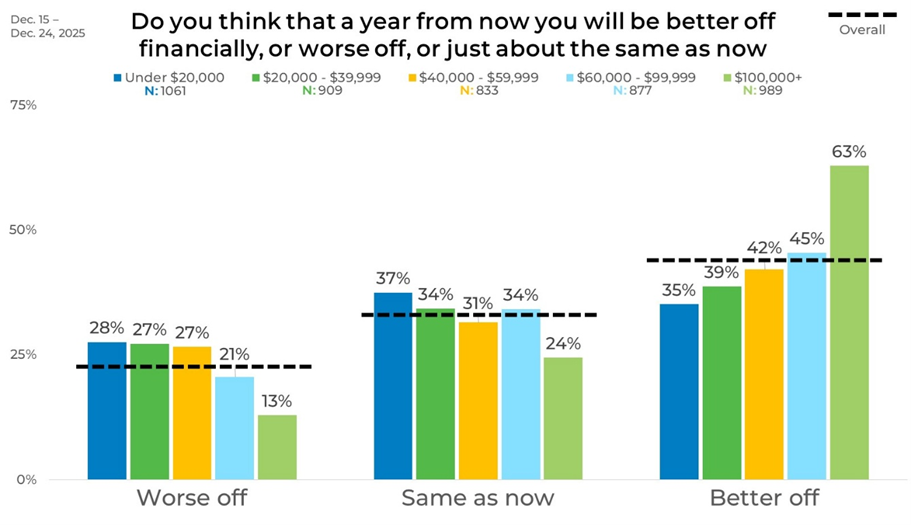
When looking at the data by income level, we found that consumers’ financial expectations rose steadily with their income level. Among respondents earning under $20,000, 35% expect to be better off, while 28% expect to be worse off. The share expecting improvement increases across income brackets, reaching 63% among those earning $100,000 or more. Higher-income respondents are also less likely to anticipate being worse off, with just 13% of the highest income group selecting that option.
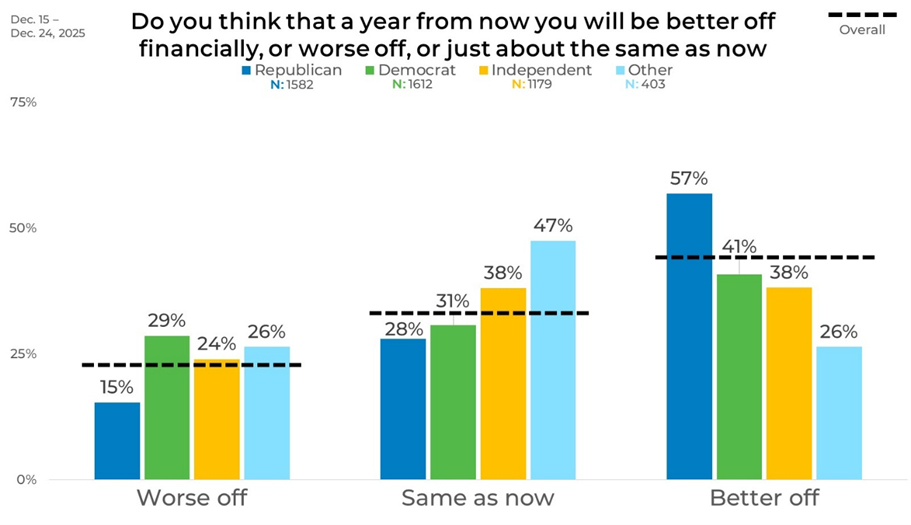
Political Affiliation
Financial expectations follow what you would expect when looking at a respondent’s political affiliation. A majority of Republicans (57%) say they expect to be better off, while smaller shares of Democrats (41%), Independents (38%), and those identifying as Other (26%) report the same. Democrats are more likely to anticipate being worse off, with 29% selecting this option, compared with 15% of Republicans.
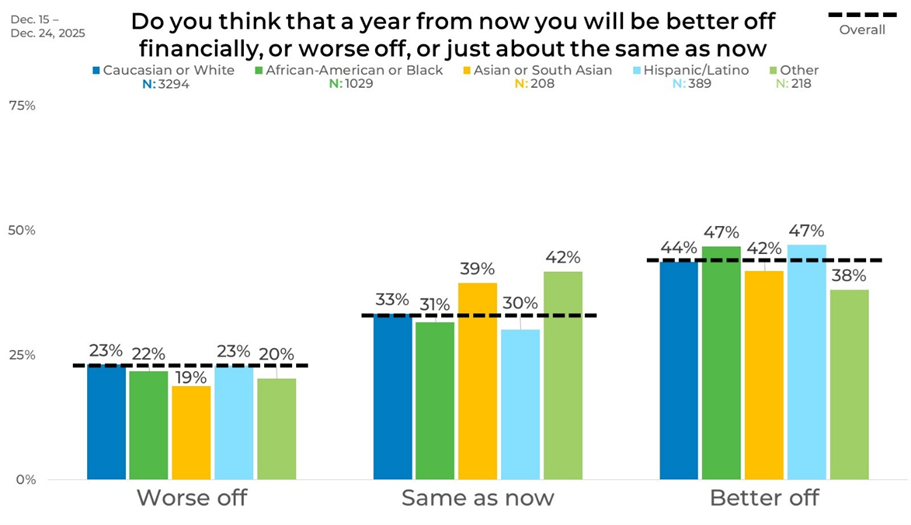
Ethnicity
Across ethnic groups, expectations of being better off range from 38% to 47%. African American or Black respondents and Hispanic/Latino respondents both report 47% expecting improvement. Asian or South Asian respondents are more likely to say their finances will stay about the same, at 39%. Expectations of being worse off are relatively similar across groups, generally around one in five respondents.
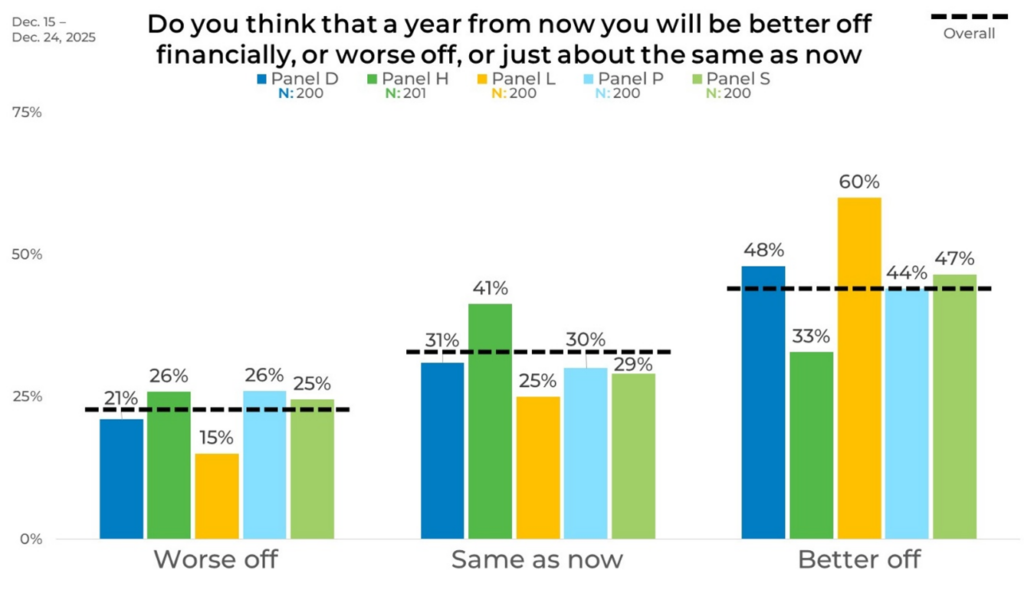
Panel
When breaking down the data by panel source, clear differences in financial expectation emerge. Panel L is the most optimistic, with 60% expecting to be better off and just 15% anticipating being worse off. Panel H stands out for a higher share expecting no change, with 41% saying their finances will be about the same. Panels D, P, and S fall between these patterns, with mid‑40% shares expecting improvement and about one-quarter anticipating being worse off, highlighting the range of expectations across panels.
This data highlights the need to understand the attitudes and behaviors of your sample sources as you select them for your studies. Picking the wrong combination can lead to misleading insights, and ultimately, the wrong decision.
Learn about how EMI’s strategic sample blending approach can help.

