
How Market Research Builds Stronger Business Plans and Smarter Decisions
March 30, 2026Excited, Skeptical, or Just Not Sure? How Consumer’s Feel About AI’s Involvement in Their Everyday Activities

Artificial intelligence is becoming more ingrained in daily life, for good or bad. As it continues to encroach into people’s everyday life and activities, the opinions around it are evolving. In our recent round of research-on-research, we asked consumers for their opinions of AI and its growing involvement in their everyday activities.
Let’s see what we uncovered.
Overall
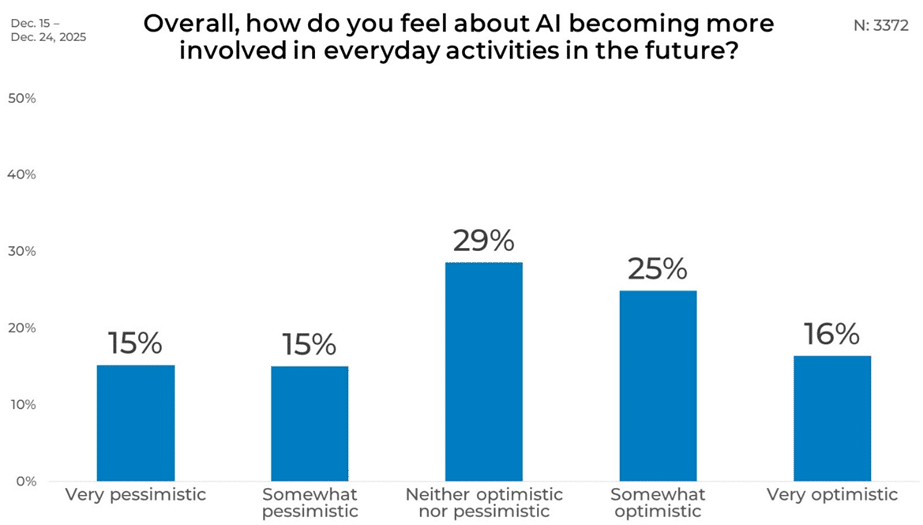
Overall, US consumer’s opinions about AI’s being involved in activities are widely spread rather than clustered at one extreme. A combined 41% express optimism, including 16% who feel very optimistic and 25% who are somewhat optimistic. Still, the largest share of respondents (29%) land squarely in the middle, saying they feel neither optimistic nor pessimistic. On the other side of the spectrum, 30% express pessimism, split evenly between those who are somewhat and very pessimistic.
Gender
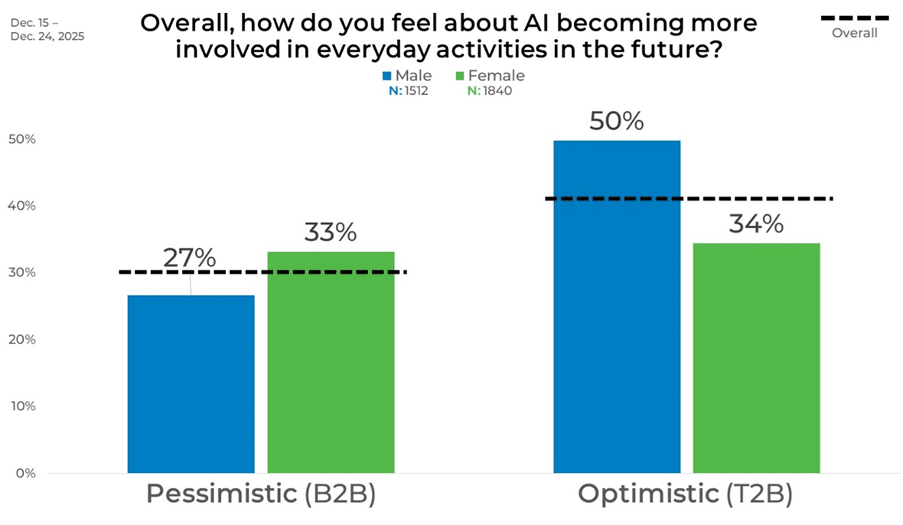
The gender split reveals a noticeable difference in tone. Men lean more positive overall, with half (50%) falling into the optimistic category, while about one-third of women (34%) say the same. Women, meanwhile, are more likely to express pessimism, with 33% in the B2B group compared with 27% of men.
Age
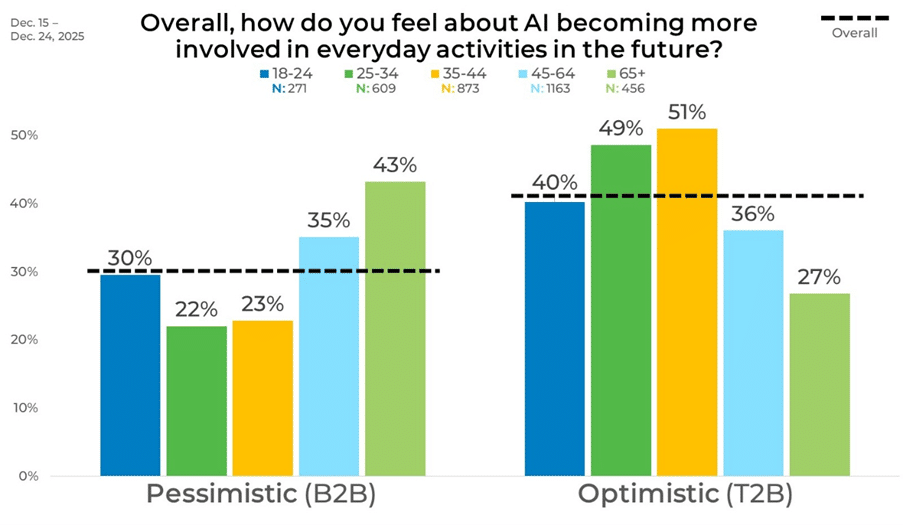
Age stands out as one of the biggest drivers in data variation. Younger and middle-aged adults tend to be the most optimistic, with 51% of those ages 35 to 44 and 49% of those ages 25 to 34 expressing positive views. Even the youngest group, ages 18 to 24, shows solid optimism at 40%. That momentum slows as age increases, dropping to 36% among those ages 45 to 64 and down to 27% among adults age 65 and older. Pessimism moves in the opposite direction, peaking at 43% among the 65+ group.
Income
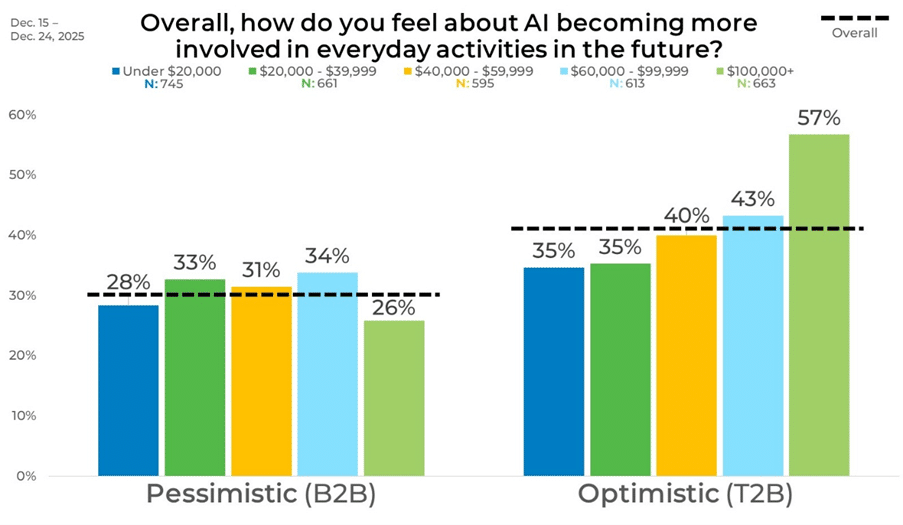
Breaking down the data by income level shows optimism increasing as income increases. At the lower end of the income scale, optimism is more muted, with 35% earning under $20,000 expressing positive views and 28% expressing pessimism.
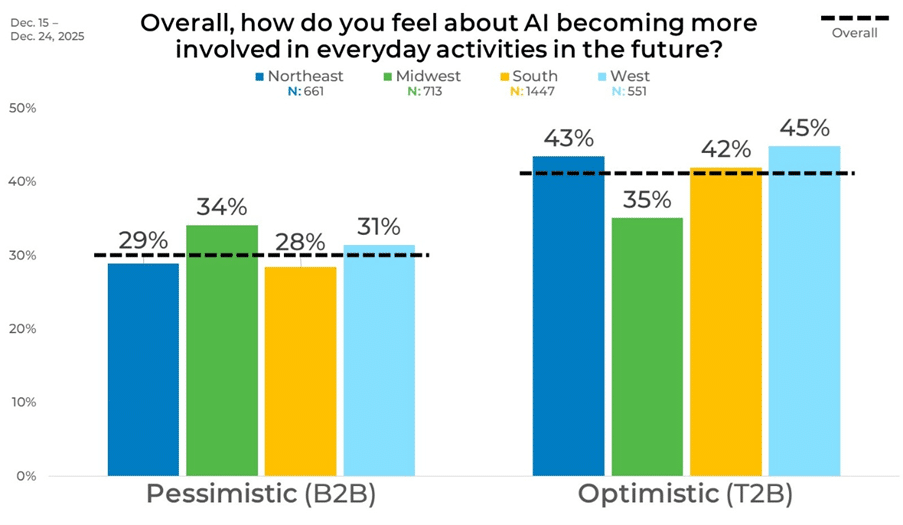
Region
Looking at the data regionally shows similarities across geographical areas. The Midwest posts the highest pessimism at 34%, slightly ahead of the West (31%), Northeast (29%), and South (28%). On the optimistic side, the West leads with 45%, closely followed by the Northeast at 43% and the South at 42%.
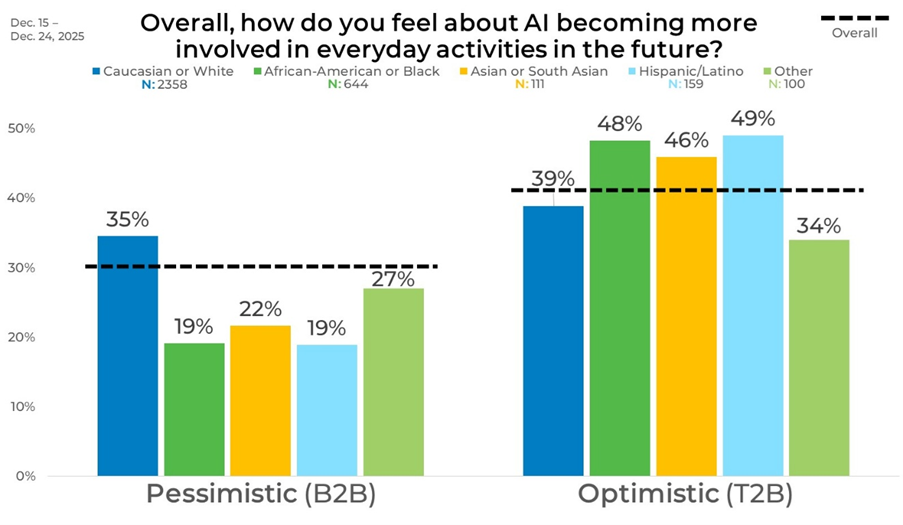
Ethnicity
There are some noticeable differences in opinions when the data is broken down by ethnicity. Caucasian respondents report the highest pessimism at 35%, noticeably higher than African American or Hispanic respondents, both at 19%. On the optimistic side, Hispanic respondents lead at 49%, followed closely by African American respondents at 48% and Asian respondents at 46%.
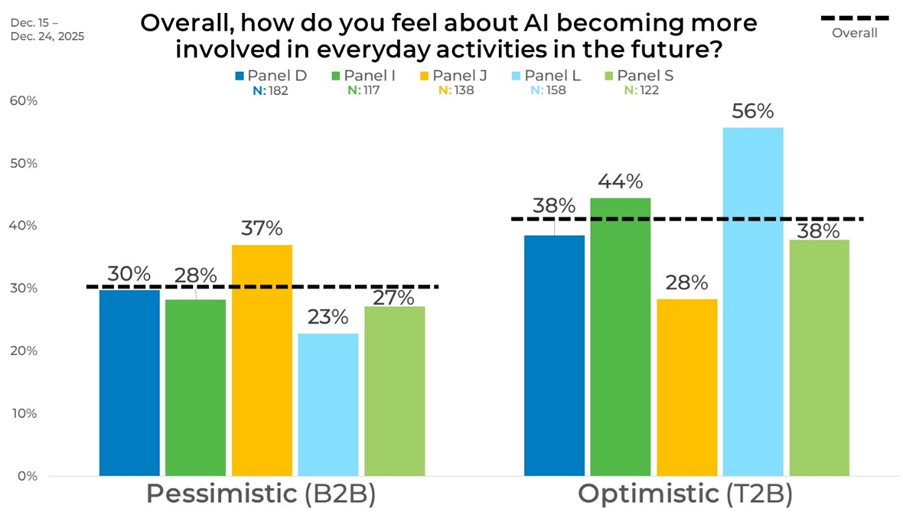
Panel
Differences in optimism and pessimism around AI’s involvement in everyday activities is really highlighted when we broke the data down by panel source. Panel L stands out clearly, posting the highest optimism at 56% and the lowest pessimism at 23%, while Panel J sits at the opposite end, with the lowest optimism at 28% and the highest pessimism at 37%. This creates a wide 28-point gap in optimism and a 14-point gap in pessimism between the two panels, the most pronounced spread in the data. By comparison, Panels D, I, and S cluster more closely together, with optimism ranging from 38% to 44% and pessimism staying between 27% and 30%.
This data reinforces the need for a sampling strategy that encompasses panel selection, including their different attitudes and behaviors. That is why you need EMI. Click the button below to see how EMI can help with your next study.

