
The 300th Episode
January 28, 2026
Hopeful, Cautious, or Bracing: How US Consumers See Their Finances One Year Out
February 2, 2026
The stock market may be hitting record highs, but stock performance doesn’t paint an accurate picture of an individual’s financial situation. In our recent round of research-on-research, we wanted to uncover how people really are feeling about their financial situation. Let’s dive into what we found:
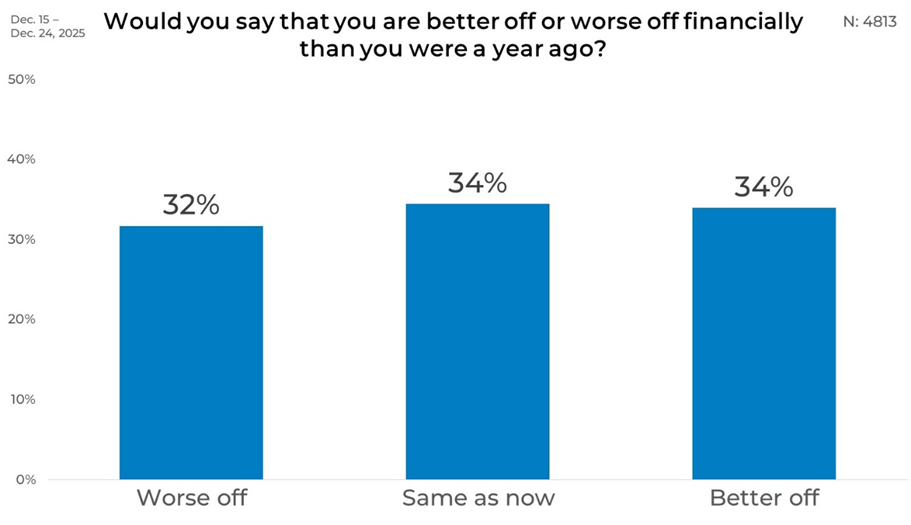
Overall
Across all respondents, there are nearly equal number of people who feel better off than worse off compared to a year ago.
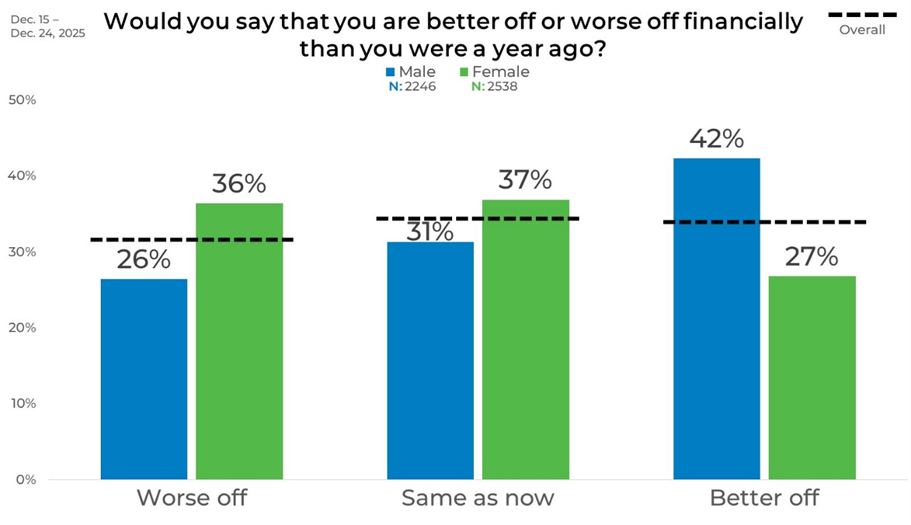
Gender
Men are more likely than women to say they are better off financially. Among men, 42% report being better off, compared with 27% of women. Men are also less likely to say they are worse off, at 26% versus 36% among women.
Women are more evenly split between feeling worse off and staying the same. 37% of women say their financial situation is about the same as a year ago, compared with 31% of men. This places women closer to balance across the three response options, while men lean more strongly toward improvement.
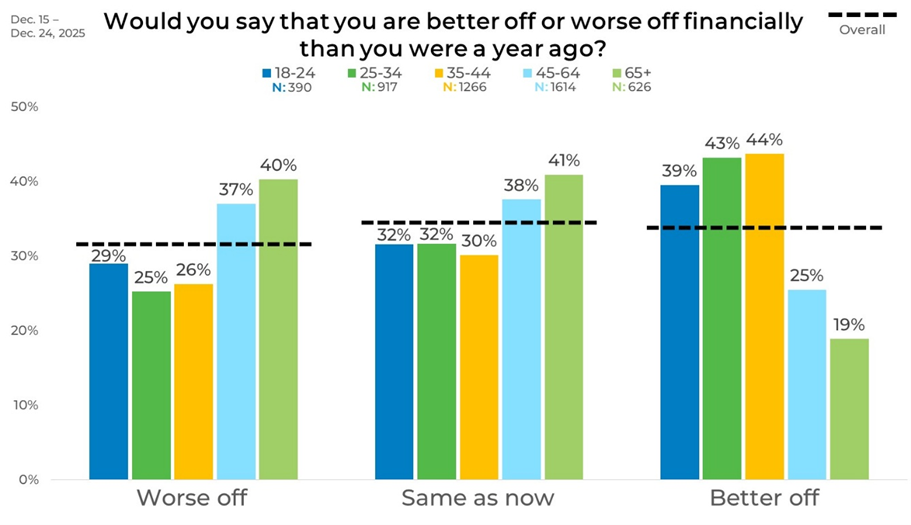
Age
Younger adults are more likely to report financial improvement than older adults. Among those ages 18–24, 39% say they are better off, compared with 29% who say they are worse off. The share reporting improvement increases further among those ages 25–34 and 35–44, at 43% and 44% respectively.
Older age groups show a different pattern. Among respondents ages 45–64, only 25% say they are better off, while 37% say they are worse off. Those ages 65 and older are the least likely to report improvement, with 19% saying they are better off and 40% saying they are worse off, alongside 41% who say their situation is unchanged.
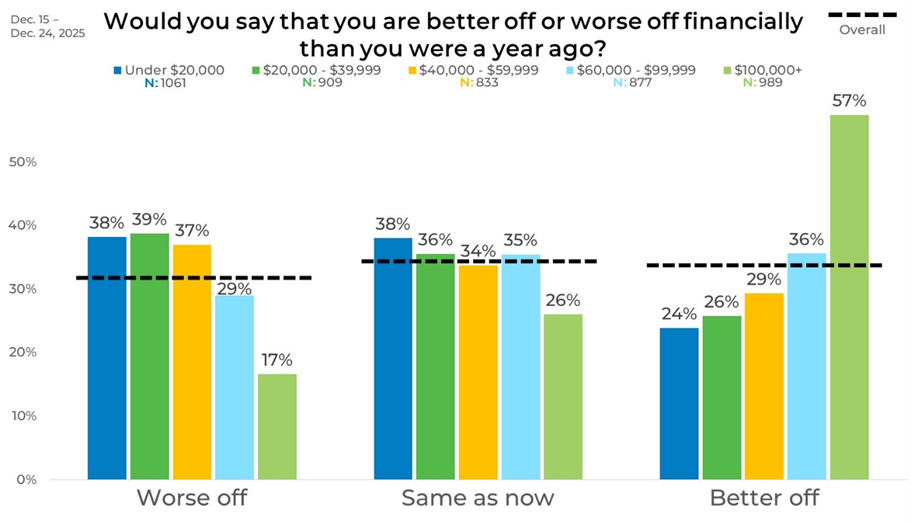
Income
Financial self-assessments vary sharply by income level. Respondents earning $100,000 or more are the most likely to say they are better off, at 57%, and the least likely to say they are worse off, at 17%. Those earning $60,000 to $99,999 also lean toward improvement, with 36% reporting they are better off.
Lower-income groups are more likely to report financial difficulty. Among those earning under $20,000, 38% say they are worse off and 24% say they are better off. Similar patterns appear among those earning $20,000 to $39,999 and $40,000 to $59,999, where roughly four in ten say they are worse off and fewer than three in ten say they are better off.
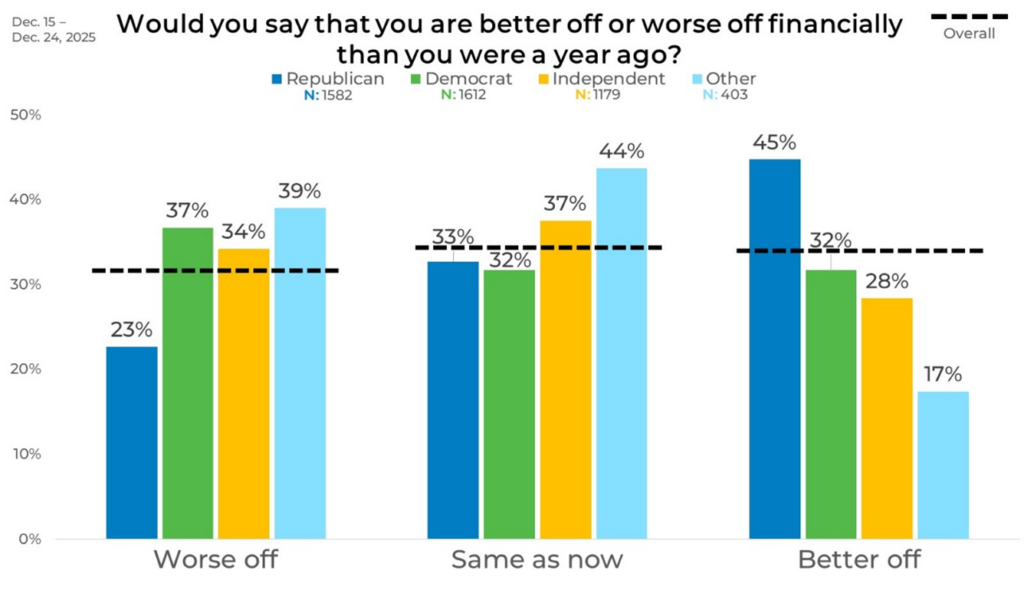
Political Affiliation
Republicans are the most likely to report financial improvement. 45% say they are better off, while 23% say they are worse off. About one-third, 33%, say their situation is unchanged.
Democrats and Independents show more mixed assessments. Among Democrats, 37% say they are worse off, compared with 32% who say they are better off. Independents report higher levels of financial strain, with 34% saying they are worse off and 28% saying they are better off. Respondents identifying with other affiliations are the least likely to report improvement, with 17% saying they are better off and 39% saying they are worse off.
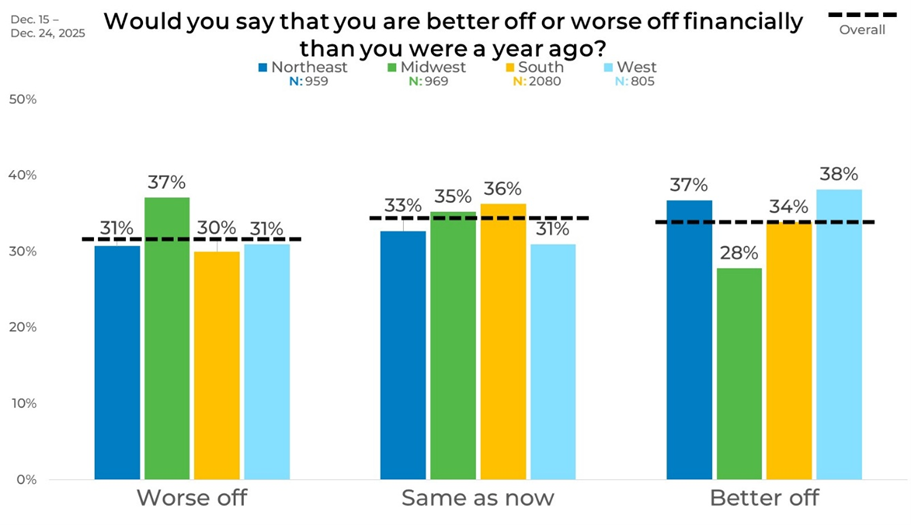
Region
Regional differences are modest but present. Respondents in the Midwest are the most likely to say they are worse off, at 37%, while only 28% report being better off. In contrast, the West shows a higher share reporting improvement, with 38% saying they are better off and 31% saying they are worse off.
The Northeast and South fall between these patterns. In the Northeast, 37% say they are better off and 31% say they are worse off. In the South, responses are more evenly distributed, with 34% saying they are better off, 30% worse off, and 36% reporting no change.
Ethnicity
Assessments differ across racial and ethnic groups, though many responses cluster near the overall average. Caucasian or White respondents are evenly split, with 33% saying they are worse off and 32% saying they are better off. African American or Black respondents are more likely to report improvement, with 38% saying they are better off compared with 28% who say they are worse off.
Asian or South Asian and Hispanic/Latino respondents also report higher levels of financial improvement. Among both groups, 39% say they are better off.

Panel
Panel results show their largest contrast between Panel L and Panel J. The share saying they are better off is 28 points higher in Panel L than in Panel J (51% vs. 23%), while the share saying they are worse off is 16 points lower (21% vs. 37%).

This data really highlights who you need to strategically blend your sample to ensure you get the most accurate insights.