

Intellicast S6E8 — A 2023 SampleCon Recap with Brad Franz and Mary Draper
March 28, 2023Intellicast S6E9 — A Quirks Chicago Recap feat. Bonnie the Bulldog
April 3, 2023
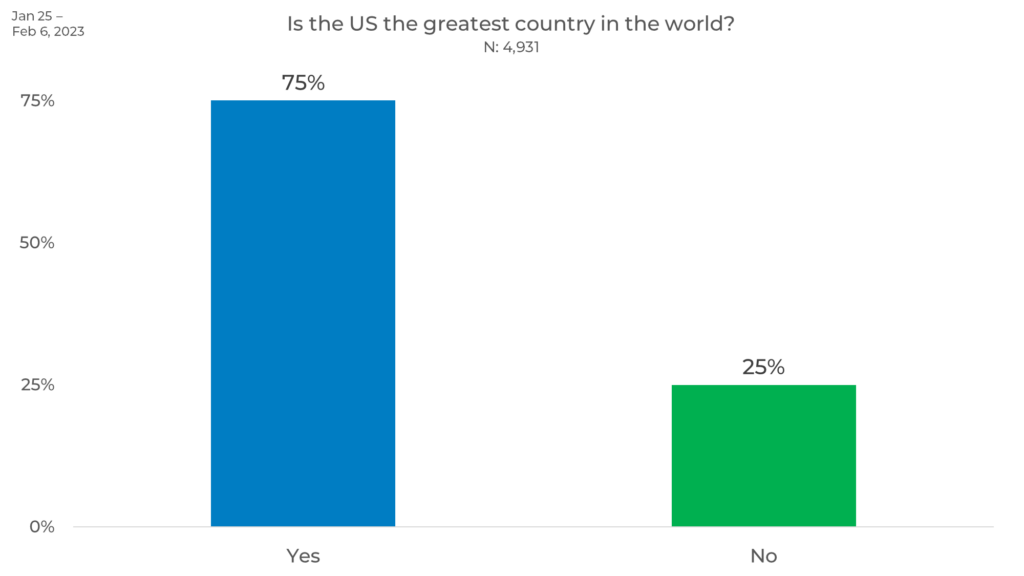
If you’ve read any of our past blogs, you know that we enjoy analyzing the perceived patriotism of different brands, political parties, and more. But what about our own individual patriotism? In our latest round of research-on-research, we asked respondents if they think the United States is the greatest country in the world.
Overall, we found that 75% of people believe the US is the greatest country in the world.
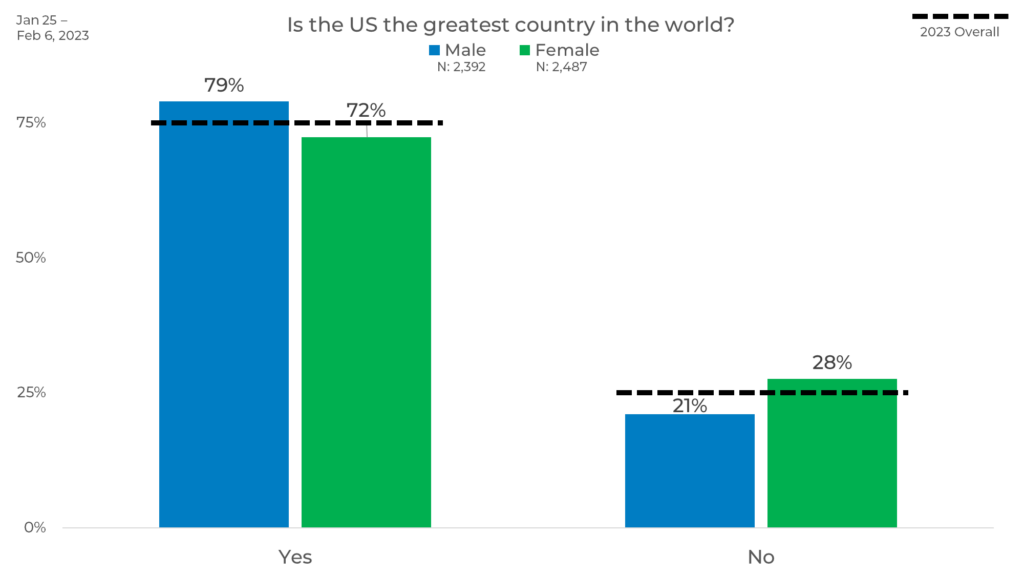
Gender
When it comes to gender, Males are 7% more likely than Females to believe that the US is the greatest country in the world. Females are 3% less likely than the overall average to think the US is the greatest country in the world.
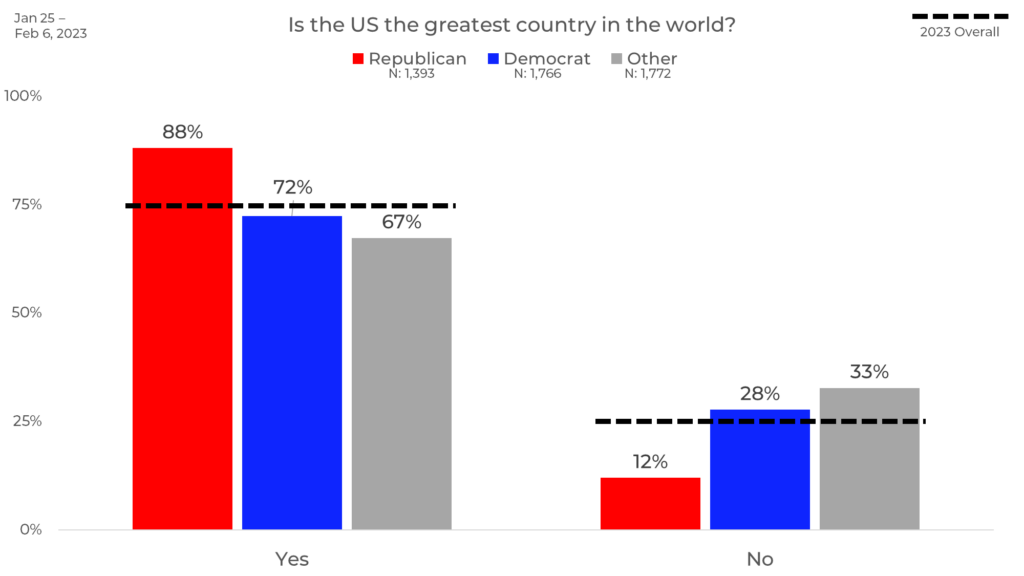
Political Affiliation
We also looked at responses by political affiliation. Republicans are 16% more likely than Democrats to believe that the US is the greatest country in the world. Those who identify with a political party other than Republican or Democrat are the least likely to believe the US is the greatest country in the world, 8% less likely than the overall average.
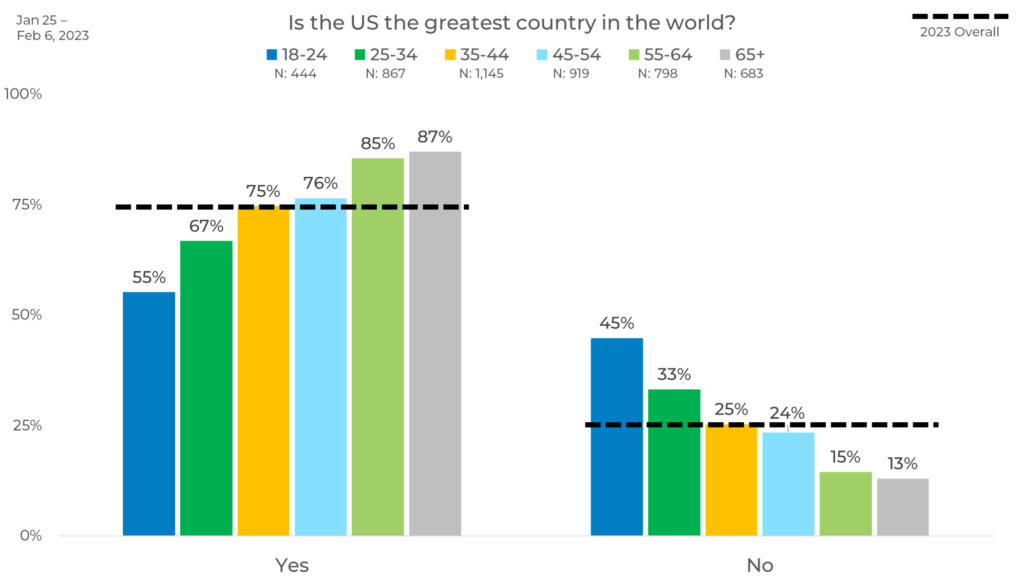
Age
When comparing responses by age, we found the older a person is, the more likely they are to believe that the US is the greatest country in the world. Those over the age of 65 are 32% more likely than 18–24-year-olds to believe that the US is the greatest country in the world.
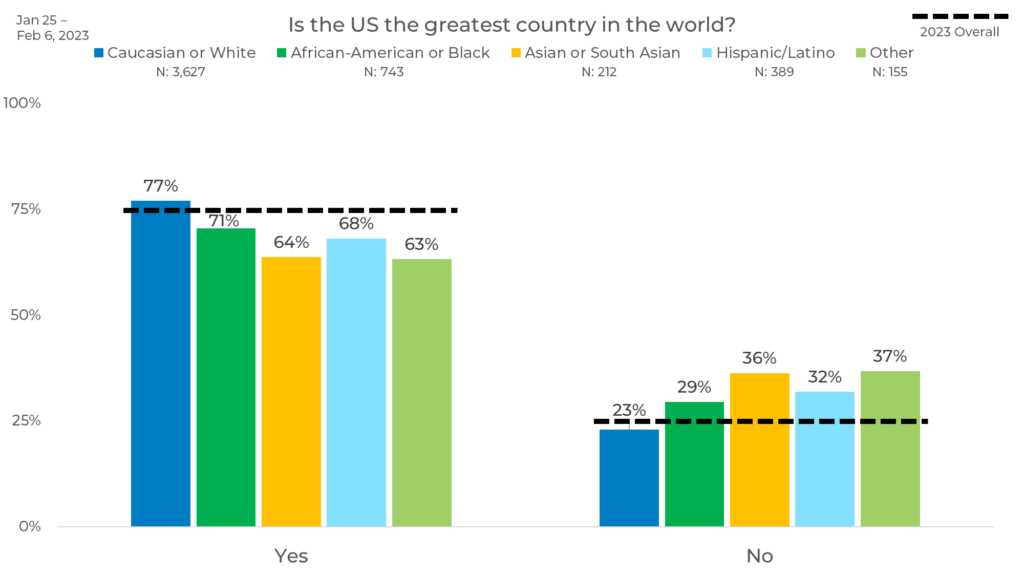
Ethnicity
When it comes to ethnicity, Caucasians are the most likely to believe that the US is the greatest country in the world at 6% more likely than any other ethnicity. Asians or South Asians and “other” are the least likely to believe the US is the greatest country in world at 4-5% less than any other ethnicity.
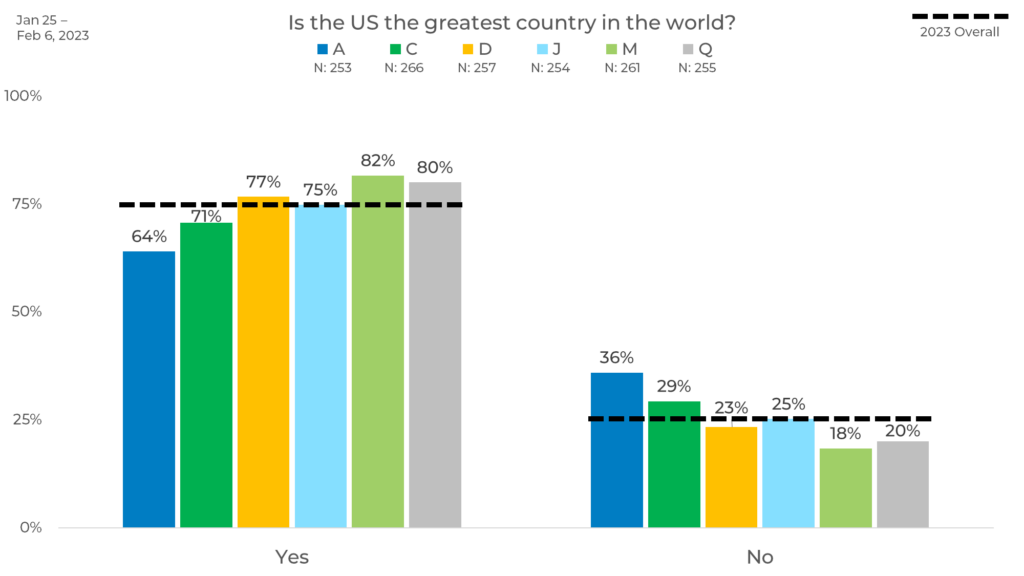
Panel
Finally, we compared results by panel. Here we see that Panel M is the most likely to think the US is the greatest country in the world and Panel A is the least likely, with an 18-percentage point difference between them. We also see differences up to 7% higher and 11% lower than the overall average. These differences can be due to variation in panel management, makeup, incentive, and more. For instance, Panel M may have more respondents over the age of 65, which we know from above is a demographic of people who are more likely to think the US is the greatest country in the world.
As we see in this blog, consumer opinion varies greatly by both demographic and panel. This can have a significant impact on your data! For instance, if someone only looked at Panel M, they might have an inflated idea of how many people think the US is the greatest country in the world. The opposite might be true if they only used Panel A. This is why strategic sample blending is the best practice to ensure any changes in your data are due to shifts in the market, not inconsistencies in your data.

