

Soccer’s Biggest Stage: Who’s Watching the 2022 FIFA World Cup?
November 15, 2022
I’m Sick of “Prodents” Stealing All the Cheese
November 28, 2022
This week signifies the official start of the holiday season with many celebrating Thanksgiving on Thursday, but it also marks the unofficial start of the shopping season on Black Friday. The rush looks a little different these days with early-bird and online options replacing camping out in lines waiting for the best deals. In preparation for the big day, we looked at people’s plans for shopping on Black Friday.
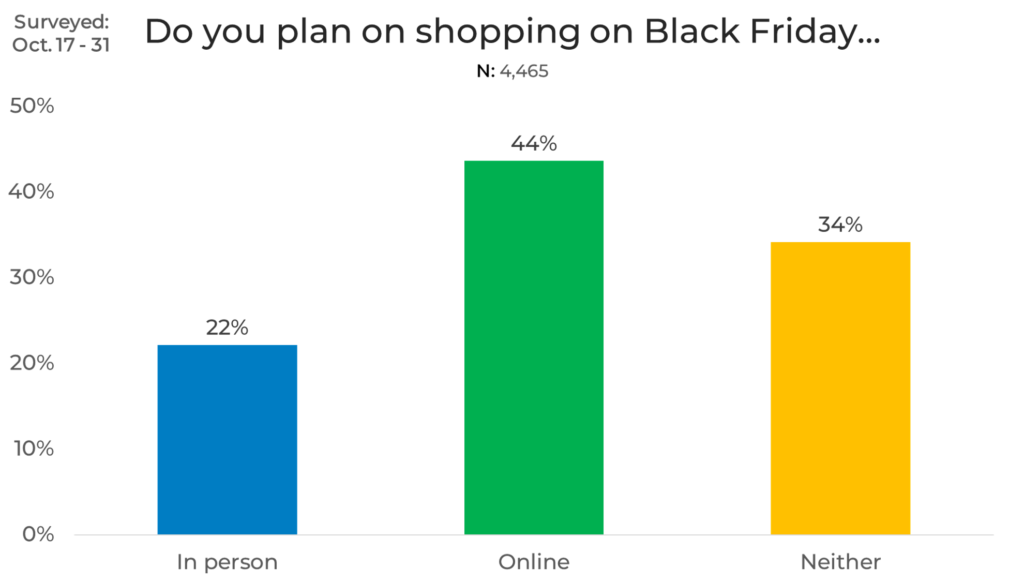
This study was fielded from October 17-31, 2022, among 4,465 respondents.
Overall, 44% of people prefer to do their Black Friday shopping online. They are 22% more likely to shop online than in person. In fact, people are 12% more likely to not shop on Black Friday at all than to shop in person, with 34% of people preferring not to shop on Black Friday and 22% of people preferring to shop in person.
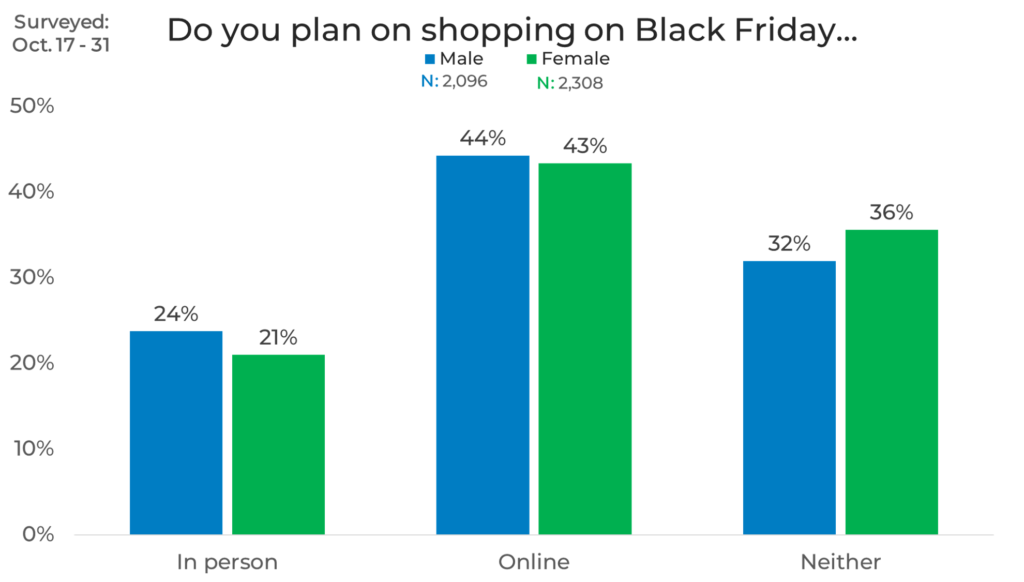
Gender
When it comes to gender, males and females are surprisingly similar in their preferences for shopping on Black Friday. Females are 4% more likely than males to not do any Black Friday shopping. Males are 3% more likely than females to do Black Friday shopping in person.
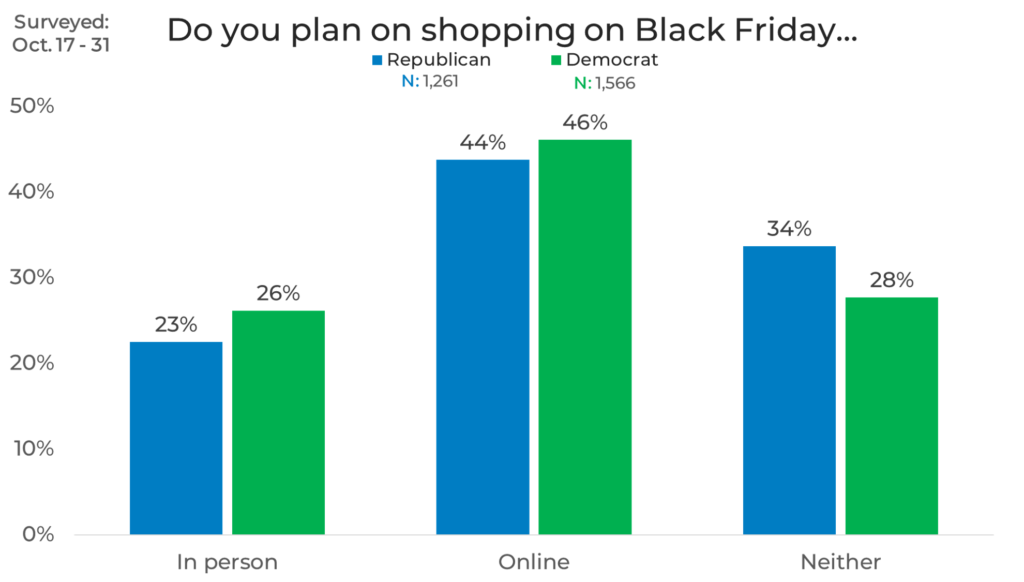
Political Affiliation
When looking at preferences by political affiliation, we see that Republicans are 6% more likely than Democrats to not do any Black Friday shopping. Democrats are 3% more likely than Republicans to do their shopping in person.
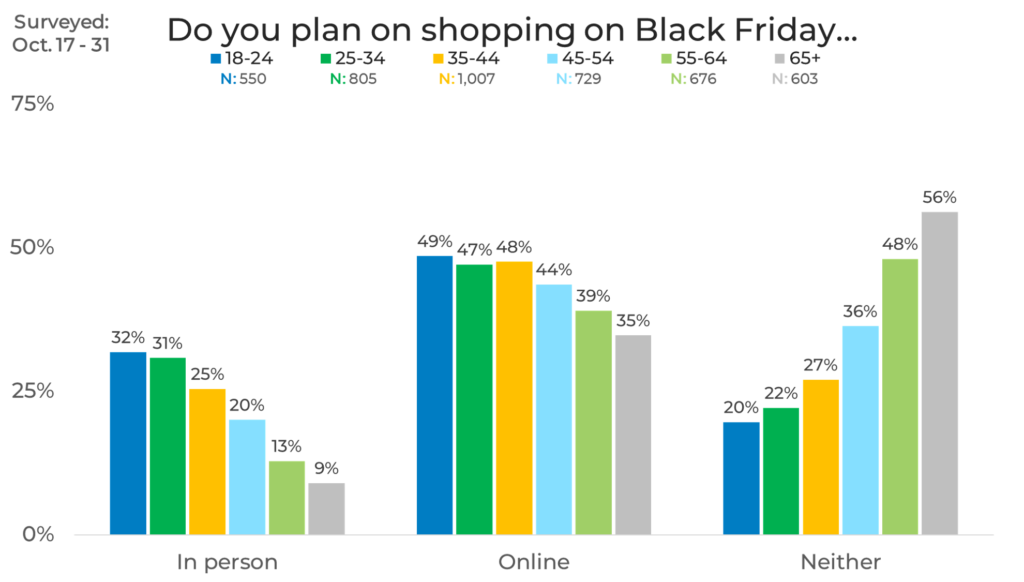
Age
We also looked at Black Friday shopping plans by age. Overall, the older you are, the less likely you are to do Black Friday shopping, with people age 65+ being 22% less likely to shop than the overall average (34%). People over the age of 65 are 36% more likely than 18–24-year-olds to say they do not plan to shop on Black Friday. People aged 18-24 are 10% more likely to do their Black Friday shopping in person than the overall average (22%).
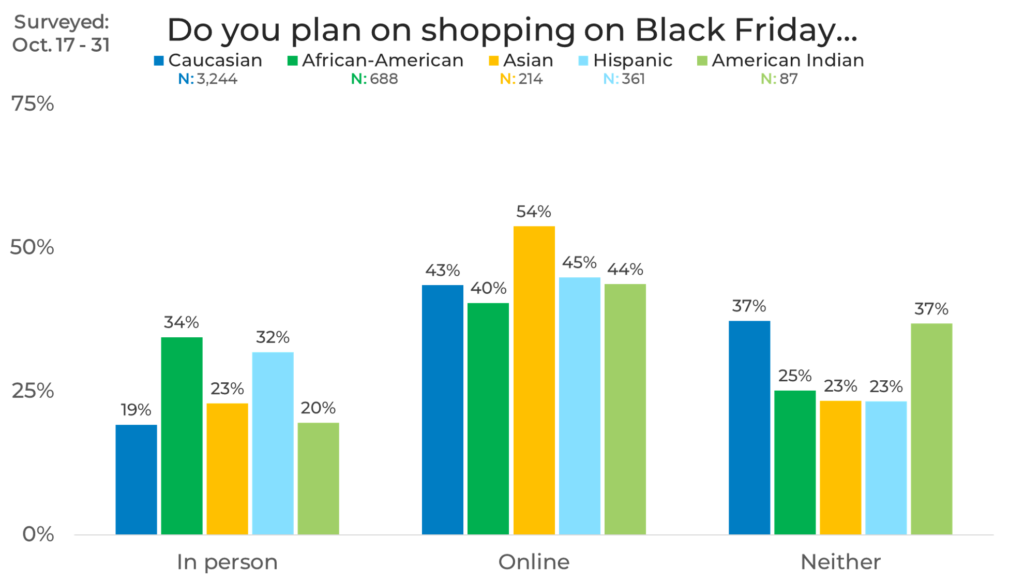
Ethnicity
When it comes to ethnicity, African Americans and Hispanics are the most likely to do their Black Friday shopping in person at 12% and 10% higher than the overall average (22%), respectively. Asians are the most likely to do their Black Friday shopping online (10% more likely than the overall average of 44%).
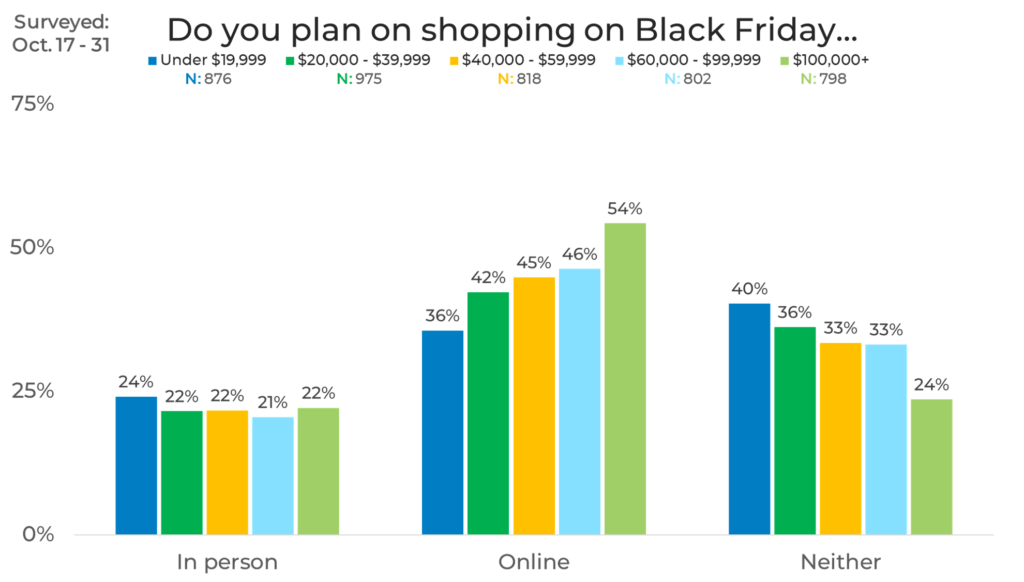
Income
When looking at preferences by income, we see that the higher the income, the more likely a person is to do their Black Friday shopping online. People with incomes of $100,000+ are 54% likely to shop online which is 10% higher than the overall average (44%). We also see that regardless of income level, plans to shop online are higher than plans to shop in person.
Panel
Finally, we looked at shopping preferences by panel. We see up to a 24% difference between panels in those who prefer to do their shopping in person, up to a 28% difference between panels in those who prefer to shop online, and up to a 33% difference between panels in those who do not plan to shop on Black Friday at all. We also see panels up to 22% higher and 21% lower than the overall averages. These wide swings in results can have a major impact on studies conducted on this topic as the results could be significantly skewed in one direction or the other depending on the panel(s) used.
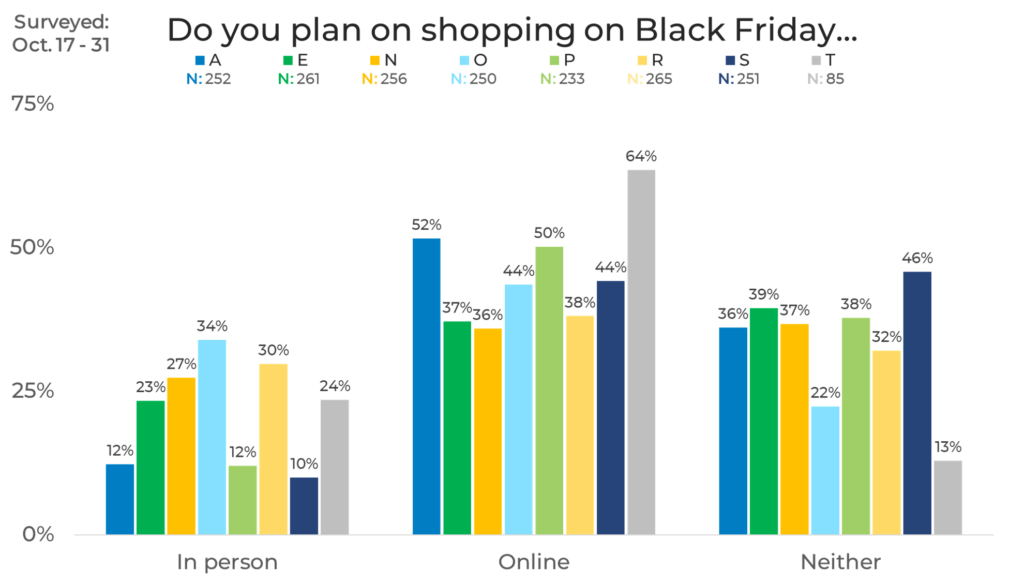
As we see in this blog, shopper preferences and plans can vary by demographic and panel. Using only a single sample source for your data can be a huge risk as it can lead to sample bias. For example, a company would not want to anticipate 64% of people shopping online when only 36% of their consumers actually use their website.
Additionally, not all sample blending methodologies are equal. Sample that is not strategically blended can lead to huge risks. For instance, if you used a blend of panels A, P, and T, you would have vastly different results than if you used panels E, N, and R. That is why strategic sample blending is the best practice to ensure your data is safe from sample bias. To learn more about how panels are different, download your copy of The Sample Landscape: 2022 Edition.

