

The Link Between Device Usage and Age: Impacts on Results
July 12, 2021
Intellicast S4E24 – Best Practices for Communities with Dan Fleetwood of QuestionPro
July 20, 2021
Respondent experience is a topic of ever-growing importance among the market research community. That is why we’ve taken the time to add questions about survey experience into our Research-on-Research and analyze them regularly to better understand overall experience and how it can be improved.
There are many factors that play into a respondent’s survey experience, but for this blog, we are focusing on experience by income, region, incentive, days of the week, and panel.
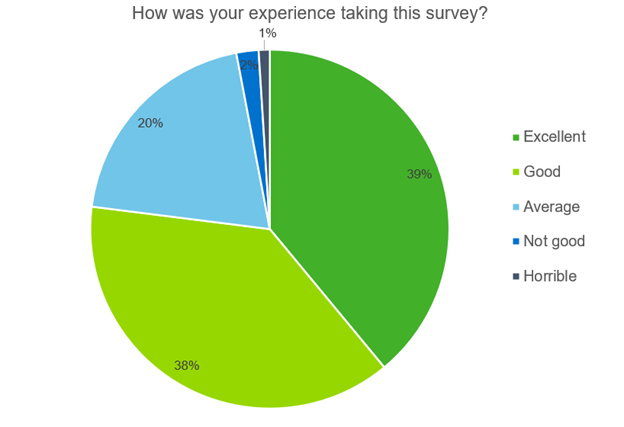
The last question of our survey asked respondents to rate their overall experience while taking the survey on a 5-point scale. 77% of respondents found their survey experience to be either good or excellent.
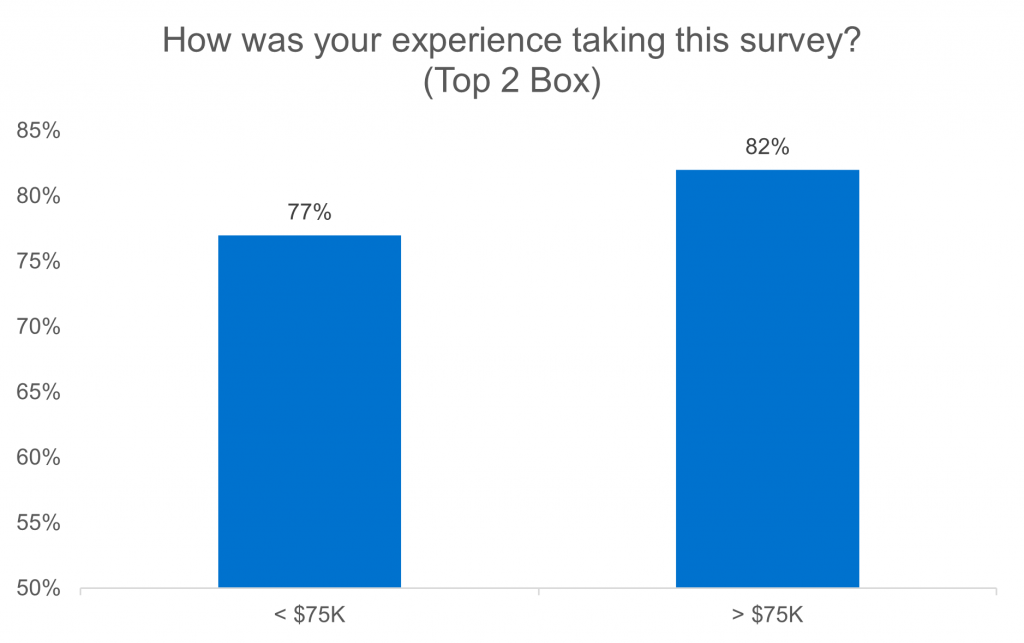
Income
When looking at this question by different demographics, we see variances in responses between panelists across different income groups. Those earning less than $75,000 annually are 5% less likely to have had a positive survey experience than those earning more.
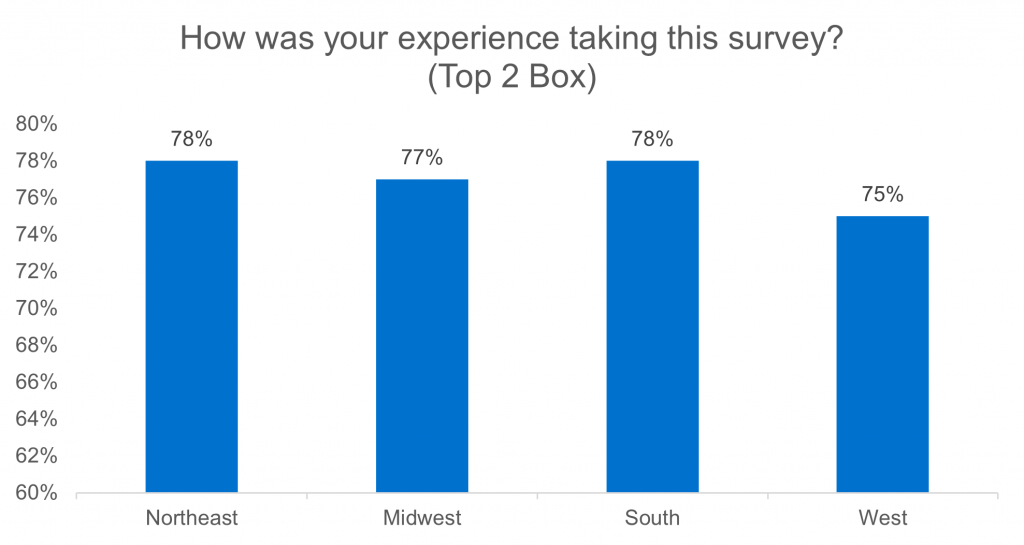
Region
There are also differences depending on which region of the US respondents are in. 78% of those in the Northeast and South had a positive survey experience, while only 75% of those in the West did.
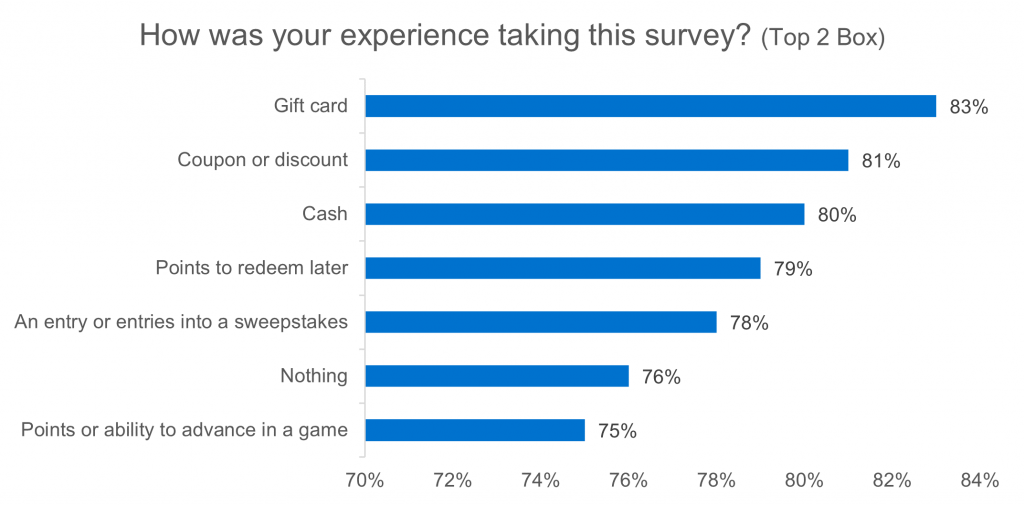
Incentive
Responses were also segmented by the incentive they received to take the survey, which could include cash, points, gift cards, or other options. Those receiving a gift card for their participation were the most likely to have a positive experience taking the survey, whereas those earning points or advancements within a game were the least likely, with an 8% total difference among groups.
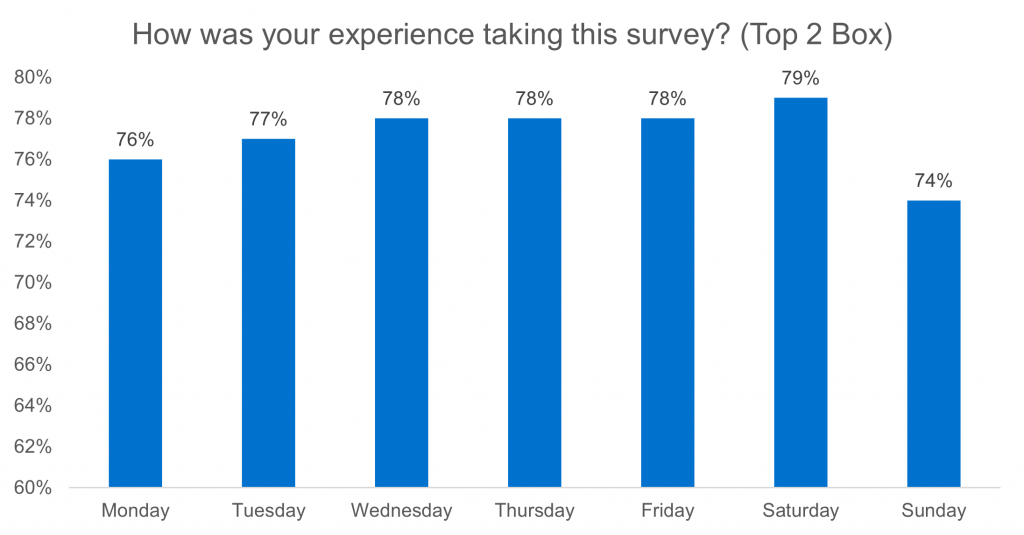
Day of the Week
Looking at respondents by the day of week they took the survey, we see that those taking the survey on Saturday had the most enjoyable experience at 79%, whereas those taking the survey on Sunday had the least enjoyable experience at 74%
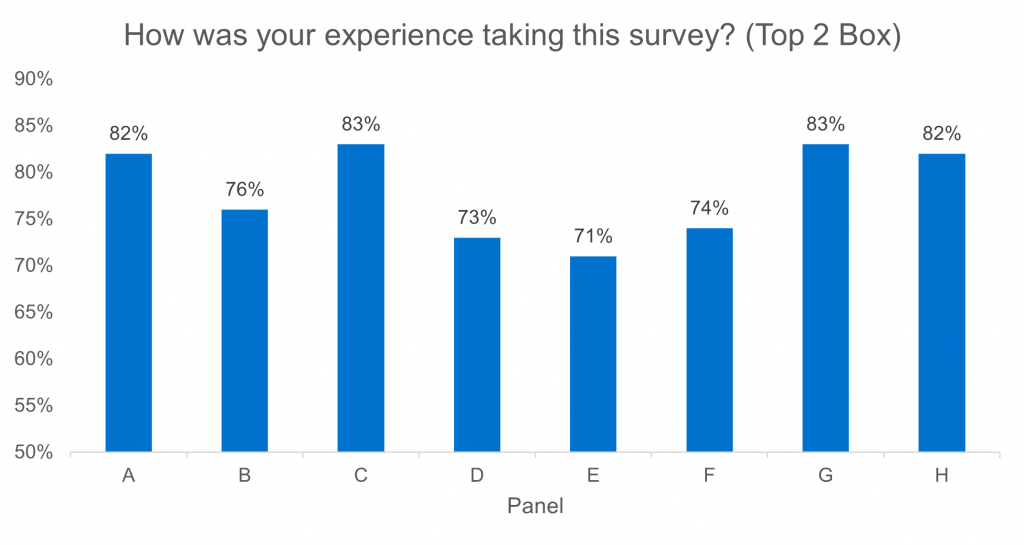
Panel
Significant differences can also be seen in survey experience by panel. Panels C and G had the highest proportion of respondents who had a positive experience at 83%, while Panel E’s proportion of respondents who had a positive experience was 12% lower at only 71%.
As we see here, there are many factors that can impact a respondent’s survey experience. We want them to have the best experience possible, so the question we must continually ask ourselves as market researchers is, how can we make it better? Check out our recent blogs to learn what our Research-on-Research has taught us about improving survey experience:

