
S3E33 – Data Quality From the Client-Side with Tia Maurer
June 29, 2020
Sample Blending Best Practices – Questions You Should Be Asking
July 7, 2020
Until just a few years ago, there were many more strict guidelines in regard to online sampling. One of these rules was that field time should include both weekday and weekend participation as to allow respondents adequate time to respond to surveys. In recent years, with the rampant growth in device ownership and many people owning multiple devices, this rule has been significantly relaxed. Speed of fieldwork seems to have taken priority as long as there is no rationale for more time in field. We looked at our latest research-on-research in order to see if there are any differences among those that respond on the weekend versus on weekdays from both an attitudinal standpoint, as well as in terms of demographics.
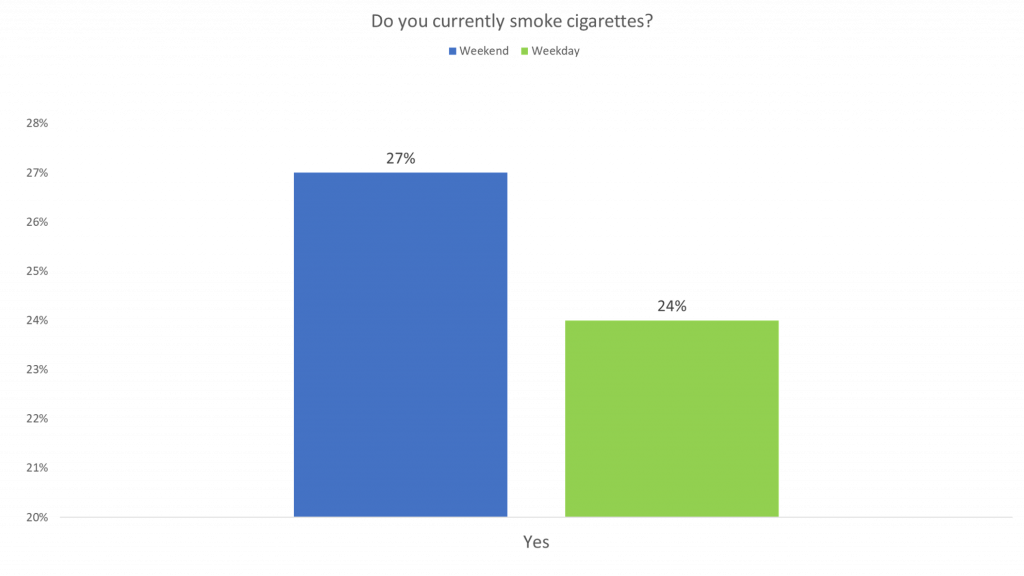
Smoking Incidence
We asked respondents if they currently smoke cigarettes and found that weekend respondents are 3% more likely to smoke cigarettes than weekday respondents
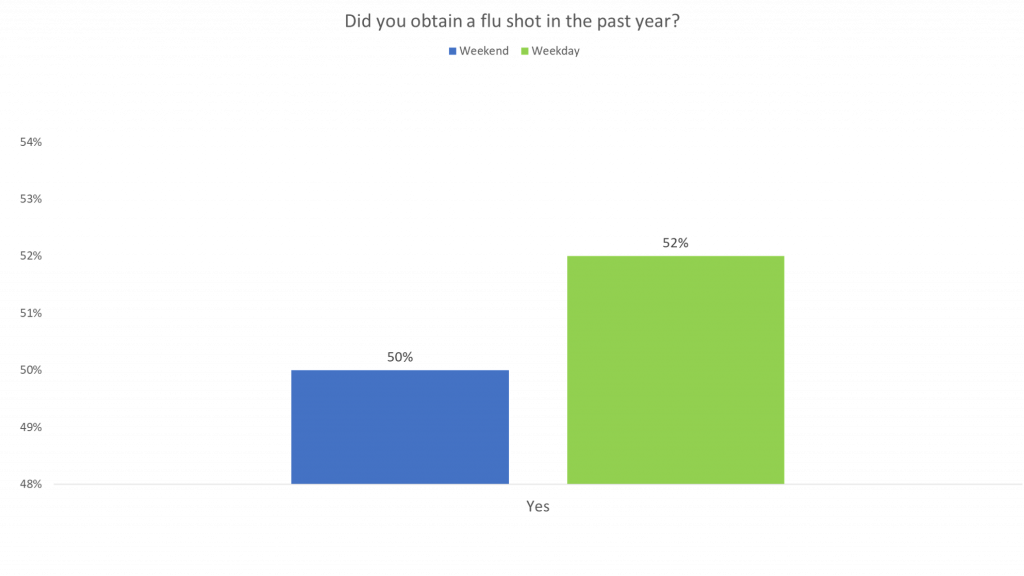
Flu Shots
We also asked respondents if they received a flu shot in the past year. Weekday respondents were 2% more likely to have obtained a flu shot than weekend respondents.
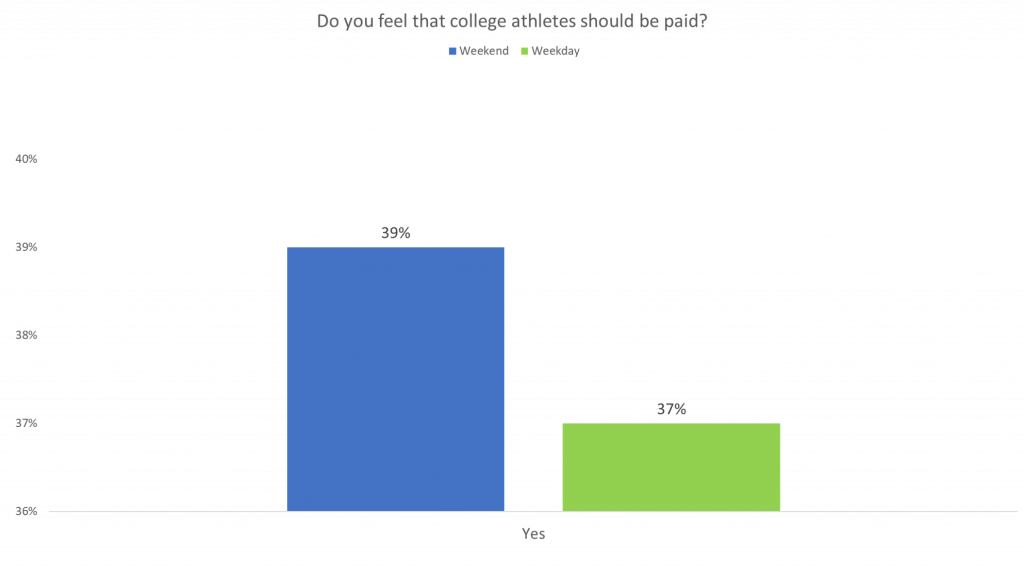
Revisiting Prior Topics
In continuation of our past research, we wanted to see if there was a difference in which respondents feel that college athletes should be paid. Weekend respondents were slightly more likely to feel that college athletes should be paid than weekday respondents (2%).
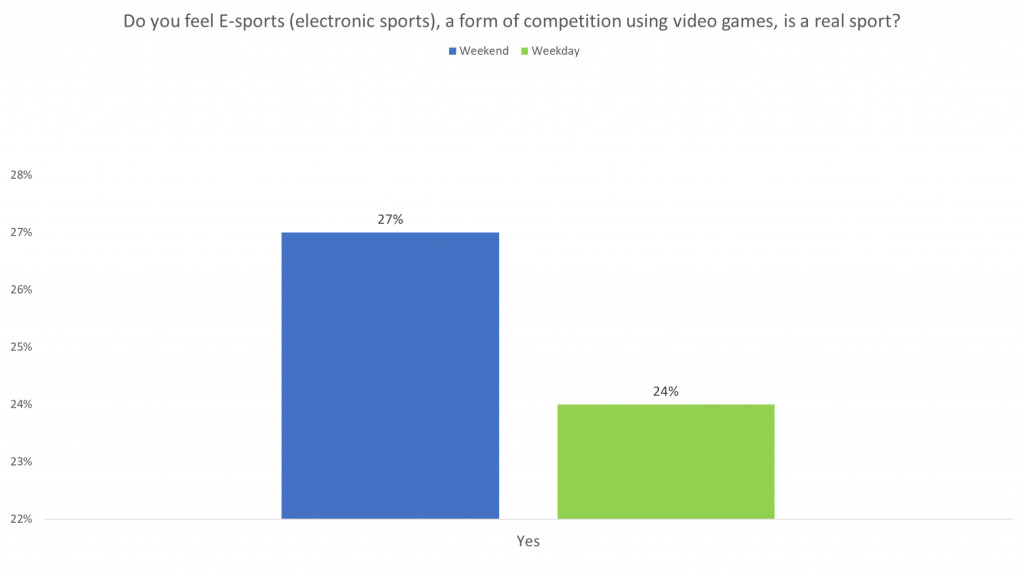
We asked respondents if they feel that E-sports (electronic sports), a form of competition using video games, is a real sport. We found that 3% more weekend respondents agreed that E-sports are real sports than weekday respondents.
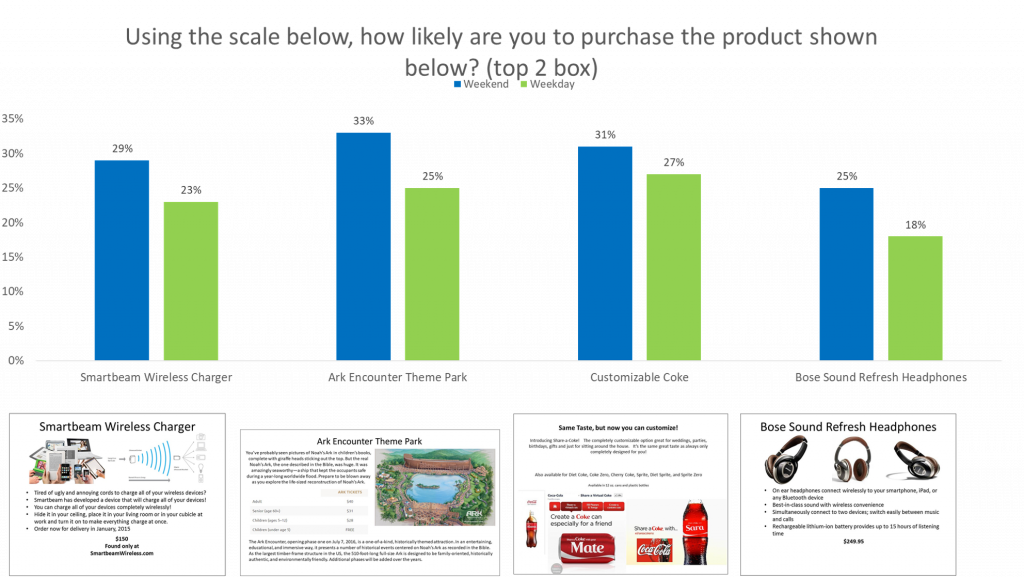
Finally, we asked respondents about a series of products and their likelihood to purchase them. Weekend respondents consistently reported a higher purchase likelihood than weekday respondents. They were 6% more likely to purchase a Smartbeam Wireless Charger, 8% more likely to purchase a ticket to the Ark Encounter Theme Park, 4% more likely to buy customizable Coke bottles, and 7% more likely to buy Bose Sound Refresh headphones.
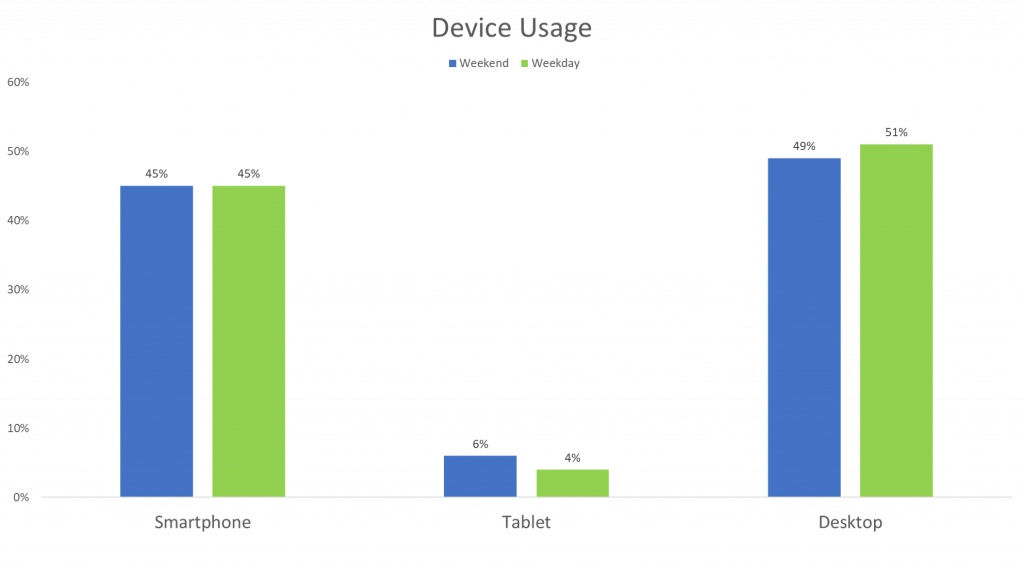
When looking at the respondents by device usage, we found that weekend respondents were more likely to use tablets and weekday respondents were more likely to use desktops. Smartphone usage was even.
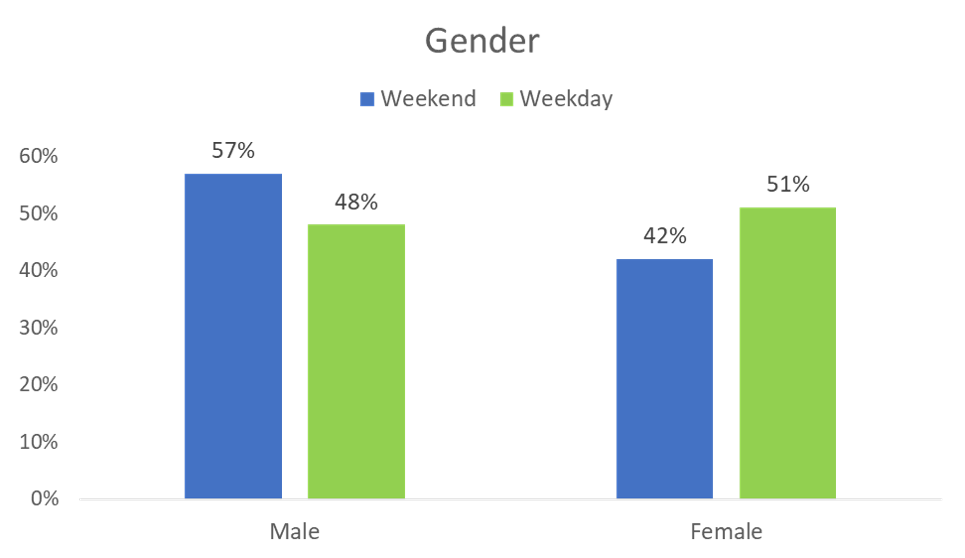
When looking at the respondents by gender, we found that male respondents are more likely to take surveys on the weekend, while females are more likely to take surveys during the week.
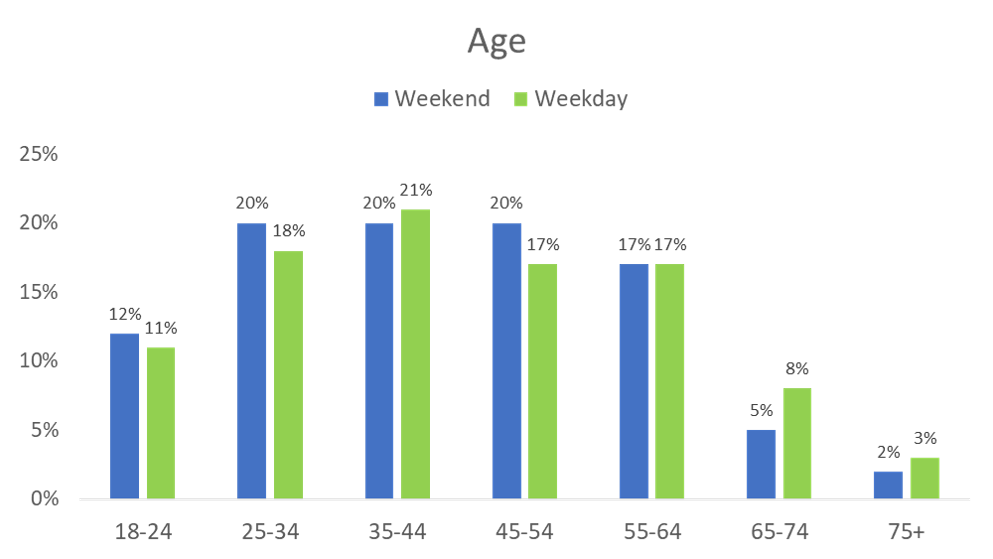
When looking at the respondents by age, we found that older respondents are more likely to respond during the week and younger respondents are more likely to respond on the weekend.
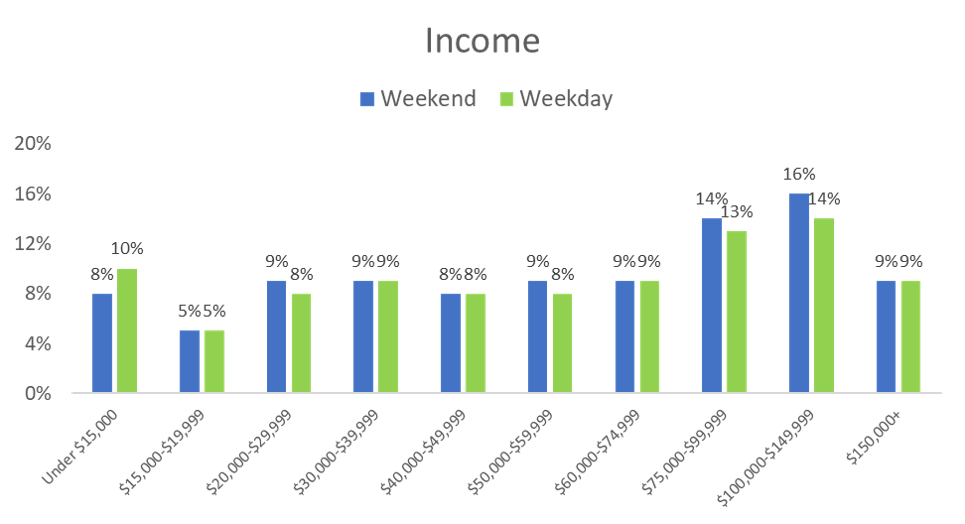
Regarding income, weekend respondents tend to make more money than weekday respondents. This may be due to differences in employment. For instance, a respondent working steadily throughout the week may not have time to take surveys during the week and may have a higher income.
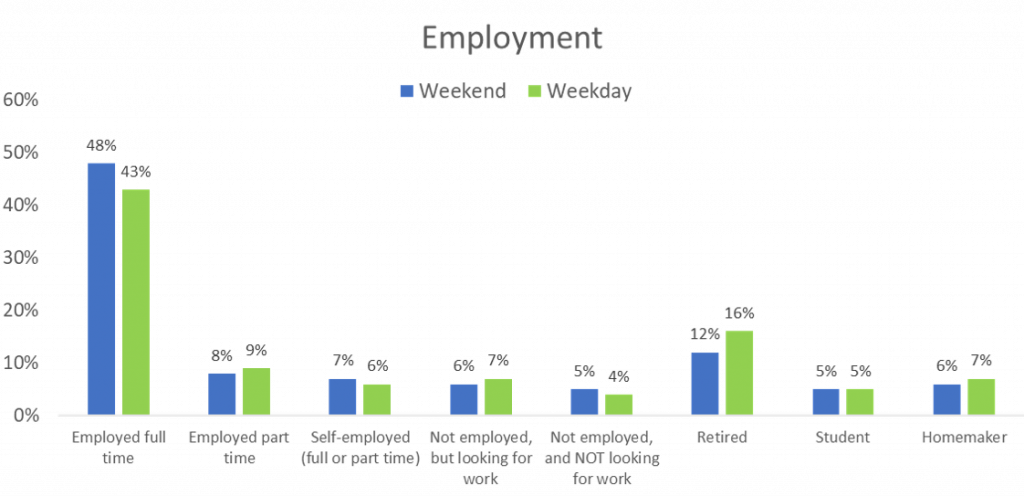
When looking at respondents by employment, we found that weekend respondents are more likely to be employed full-time and weekday respondents are more likely to be retired.
As this data shows, there are clear differences between respondents who reply on the weekend versus those who reply throughout the week. We have seen that there are minor attitudinal differences as well as demographic differences.
If possible, we recommend launching your study to include both weekend and weekday participation. Given the current situation with Coronavirus and other changes to behavior including working from home, a longer field time can help your survey data to be more representative.
To learn more about people’s perceptions of different brands, download our 2020 Sample Landscape report and check out our other blogs from the Sample Landscape series!
Respondent Experience and How It Can Be Improved
How COVID-19 Behaviors Differ by Sample Provider

